OECD Unemployment Rate Stable At 6.9% In December 2020, 1.7 Percentage Points Higher Than In February 2020
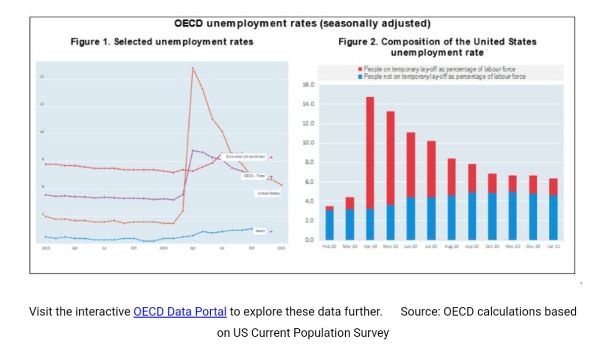
The OECD area unemployment rate was stable at 6.9% in December 2020, remaining 1.7 percentage points above the level observed in February 2020, before the COVID-19 pandemic hit the labour market.[1]
In December, the unemployment rate was also stable in the euro area, at 8.3% (1.1 percentage points above its February 2020 level), with falls of 0.2 percentage point or more in Belgium, Lithuania, Portugal and Slovenia and increases of 0.2 percentage point or more in Austria, Finland, Italy and Luxembourg.
In the United States, where the number of people on temporary lay-off has been relatively steady since October (see Figure 2), the unemployment rate was stable at 6.7%, 3.2 percentage points higher than in February 2020. In Canada, it increased by 0.2 percentage point (to 8.8%). More recent data for January 2021 show that the unemployment rate declined by 0.4 percentage point in the United States (to 6.3%) while it continued to rise (by 0.6 percentage point, to 9.4%) in Canada. In December, the unemployment rate was unchanged in Japan, at 2.9% (0.5 percentage point above its pre-pandemic level). It increased by 0.5 percentage point in Korea (to 4.6%), while it continued to decline in Australia (to 6.6% in December, from 6.8% in November), Colombia (to 14.6%, from 15.3%) and Mexico (to 4.2%, from 4.5%).
In spite of stable aggregate unemployment rates in the OECD and the euro area, in December, the OECD youth unemployment rate (people aged 15 to 24) increased slightly to 14.4% (from 14.2% in November). In the euro area the youth unemployment rate increased to 18.5% (from 18.1% in November), the second consecutive monthly increase (see Table 3).
More generally, it should be noted that unemployment statistics do not account for the full amount of labour market slack due to Covid-19, as some non-employed people may be classified as “out of the labour force” because, due to the pandemic, they are either not able to actively look for a job or are not available to work.[2]
See the full release.
See the tables and charts in Excel.

Visit the interactive OECD Data Portal to explore these data further. Source: OECD calculations based on US Current Population Survey
[1] Some care is needed in interpreting the fall in the OECD area unemployment rate compared to the April peak, as this largely reflects the return of temporary laid-off workers in the United States and Canada, where they are recorded as unemployed. For Canada and the United States, the statistical treatment of people on temporary layoff is different from other countries, where these people are typically recorded as employed. See the note on the divergence in employment and unemployment statistics during the Covid-19 crisis on next page.
[2] The ILO guidelines define the unemployed as “all those of working age who were not in employment, carried out activities to seek employment during a specified recent period and were currently available to take up employment given a job opportunity”. Some not-employed people may be classified as “inactive/out of the labour force” because, due to the pandemic, they are either not able to actively look for a job even if they are available to work or are not available to work because of family responsibilities as schools and care services are closed.


 UN Special Procedures - Human Rights: UN Expert Urges States To Finance Inclusive And Sustainable Development, Not A War Economy
 Amnesty International Aotearoa NZ: Global - Recorded Executions Highest Since 2015
 Save The Children: MYANMAR - Heavy Rains Heighten Risk Of Disease Outbreaks Following Earthquake
 UNICEF Aotearoa NZ: Aid Cuts Threaten Fragile Progress In Ending Maternal Deaths, UN Agencies Warn
 Médecins Sans Frontières: Concern Over Planned Deportation Of Afghan Refugees In Pakistan
 European Cultural Centre: Time Space Existence 2025 - A Collective Call To Repair, Regenerate, And Reuse