CALTECH/MIT: Exit Poll's Bush Vote Underestimate
VOTING MACHINES AND THE UNDERESTIMATE
OF THE BUSH
VOTE
CALTECH/MIT
VOTING TECHNOLOGY PROJECT
NOVEMBER
9, 2004
VIEW ORIGINAL PDF VERSION
Voting Machines and the Underestimate of the Bush Vote
Summary
1. A series of claims have been made in recent days alleging that discrepancies between exit poll results and the presidential vote in certain states provides evidence of malfeasance in those states. These claims seem to be concentrated on states using electronic voting systems.
2. Exit polls predicted a significantly greater vote for Kerry nationwide than the official returns confirmed, but there is not any apparent systematic bias when we take this same analysis to the state level.
3. Analysis of deviations between the exit polls and the official returns show no particular patterns for states using electronic voting; nor does this analysis reveal any patterns for states using other forms of voting systems.
4. We conclude that there is no evidence, based on exit polls, that electronic voting machines were used to steal the 2004 election for President Bush.
Analysis
Ever since election night, supporters of John Kerry --- or at least, opponents of electronic voting machines --- have come close to implying that the election was stolen by the manipulation of paperless voting systems, particularly the new electronic voting machines. One widelycirculated analysis claimed that electronic voting machines gave Bush a mysterious 5% advantage, compared to the intentions of voters as measured by exit polls.1 The initial alarms that were struck on Election Day and immediately thereafter were based on hasty analyses using exit polls that were not designed to predict the outcome of the election. It is therefore critical that we examine whether the initial charges bear up to scrutiny, now that Election Day is receding into the past and we can approach the question more carefully.
Two general charges have been made in a series of e-mails and web posting over the past several days. The first is that the exit polls were systematically more pro-Kerry than the “actual” results that were reported after the votes in the “battleground states” had been counted. The second is that the exit polls were systematically more pro-Kerry in the states that used electronic voting machines. To the minds of some, both patterns are evidence that the 2004 election was tampered with, resulting in Kerry’s defeat.
The first question to ask is, “How badly did the exit polls predict the outcome of the election?” The answer is, “not too badly.” Overall, the final exit polls, as reported by cnn.com, estimated that President Bush had Election Day support from 49.8% of the electorate, compared
1 “States with electronic voting machines gave Bush mysterious 5% advantage; bloggers do the math that broadcast networks fail to follow,” http://www.bluelemur.com/index.php?p=388, accessed Nov. 5, 2004.
2
to the 51.1% he received from the tallied votes.2 The polls were off from the official returns by 1.3%. In typical public opinion polls, such a difference would be within the poll’s “margin of error.” However, with the unusually large number of observations in the Election Day exit poll - -- over 76,000 --- this difference is well outside the margin of error. The exit poll numbers and the official returns are significantly different, in a statistically sense.3 Depending on which numbers one chooses to trust, the poll is either too pro-Kerry or the official results are too pro- Bush.
That the poll was “too pro-Kerry” has elicited considerable commentary from observers of all stripes, particularly in light of the fact that the 2000 exit polls were too “pro-Gore.” How this happened two times in a row will undoubtedly be a subject of much investigation in the coming months.4 However, it is important to note that all of the charges of election rigging using electronic voting machines pertain to states, since elections are run as state and local affairs. At the state level, the samples are much smaller (running from 622 to 2,862), and therefore the room for random variation is much greater. If we look at the 51 separate exit state polls, we see that 30 predicted more votes for Kerry than he actually got, while 21 predicted more votes for Bush than he actually got. Therefore, at the state level, the polls favored Kerry less than the sum of all the polls aggregated up to the national level. Furthermore, if we do a statistical test to see whether the differences between the exit polls and the official returns are significant, only three out of 51 are.5 Therefore, while it is fair to say that the exit polls predicted a significantly greater vote for Kerry nationwide than the official returns confirmed, it is not immediately apparent that any systematic biases are revealed when we take the analysis down to the state level.
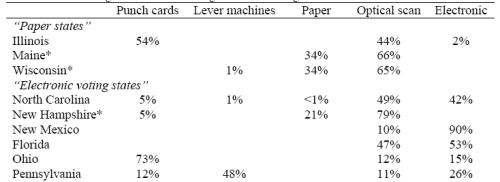
One web site made a specific charge that it was states with electronic voting machines where the discrepancies between the poll results and the official counts were the most egregious.6 In particular, a comparison of the exit poll and machine count results from Illinois, Maine, and Wisconsin (states with “paper ballots”) revealed that the machine counts closely matched the exit polls. A comparison of North Carolina, New Hampshire, New Mexico, Florida, Ohio, and Pennsylvania, with “electronic voting,” revealed a sharp drop in Kerry support when moving from the exit polls to the official results.
The analysis on the “Blue Lemur” web site (bluelemur.com) is riddled with problems.
First, it is not clear where the exit poll numbers used in the analysis came from. Presumably they were from the initial exit poll results that were leaked on slate.com early in the afternoon of Election Day. These are the same numbers that immediately appeared suspicious to many analysts who saw them, since the respondents were too female, too Western, and too
2 The primary election return data source for this paper is uselectionatlas.com, supplemented by official state web sites, to update the election returns.
3 The standard error of the difference between the two percentages of 0.18%.
4 For an insightful discussion of the exit poll difficulties see this online chat with Washington Post managing editor Steve Coll: http://www.washingtonpost.com/wp-dyn/articles/A13590-2004Oct31.html
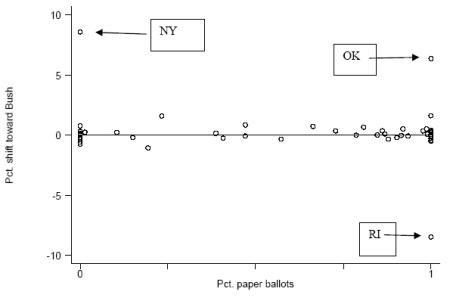
5 Rhode Island gave 47.4% support to Kerry in the exit poll, compared to the actual 38.9%. The two other statistically differences were Oklahoma (59.2% exit poll vs. 65.6% official return) and New York (31.9% exit poll vs. 40.5% official return). Note that none of these states was a “battleground state.”
6 http://www.bluelemur.com/index.php?p=388
3
Democratic.7 If this diagnosis is even a partial explanation for why the exit polls seemed to be “off” in the early going, it may be reason enough to expect for the official results to favor Bush, compared to the early exit poll numbers.
Second, the Blue Lemur analysis mischaracterizes the voting machines used in all but one of the “electronic states” and misses the complexity of voting machine usage in all states. New Hampshire only uses traditional paper ballots or optical scanners. Categorizing it as an electronic voting state is simply an error. Similarly, the bulk of Ohio’s ballots were cast using the old, discredited punch cards. The confusion here is probably due to the fact that Ohio had originally planned to use DREs in 2004, but then demurred when the “voter verified audit trail” controversy came along. While roughly half the ballots cast in Florida and North Carolina were cast on DREs, the other half were cast on optically scanned paper ballots. Certainly, if the vote had been hacked electronically, the effects would have been more subtle in these states than in New Mexico. Finally, only 1/4 of Pennsylvania’s ballots were cast on electronic machines.
Granted, nearly half of the Keystone State’s ballots were cast on the old mechanical lever machines, which have potential hidden programming problems of their own. Nonetheless, the only electrons involved in voting in Pennsylvania are in the incandescent light bulbs in the booths.
Table 1. Percentage of electorate using different voting methods in “Blue Lemur” states Punch cards Lever machines Paper Optical scan Electronic

Source: Election Data Services for voting machine types, except for states marked with a (*). Voting machine type for machines marked with a (*) provided by state election officials. uselectionatlas.org for voting populations, except for states marked with (*), which was provided by state election officials.
As Table 1 suggests, many states use a variety of voting machines. If nefarious vote stealers had commandeered electronic voting machines on George Bush’s behalf, then we would expect for the greatest discrepancies between the exit polls and the official counts to have been in the states that used electronic machines the most. States that used purely paper systems should show no systematic difference between the exit polls and the official counts. The remainder of this note undertakes precisely this type of analysis.
7 Richard Morin, “New Woes Surface in Use of Estimates,” Washington Post, Nov. 4, 2004, p. A29, accessed at http://www.washingtonpost.com/wp-dyn/articles/A23580-2004Nov3.html, accessed on Nov. 8, 2004.
4
In assessing the efficacy of voting machines, it is usually considered good practice to make as fine a distinction as possible among different types of machines. The electronic vote stealing speculations takes the opposite tack, of lumping all paper systems together. Therefore, for the remainder of this paper, I treat voters who use punch cards, hand-counted paper ballots, and optically scanned ballots as all voting on “paper.” Because the logic of the vote stealing speculations extends to mechanical lever machines, it is tempting to lump lever machines and DREs together, as well. However, for the sake of retaining a bit of clarity, I keep them separate.
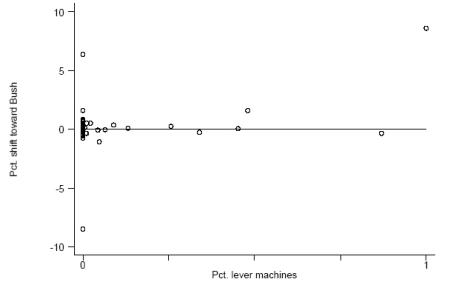
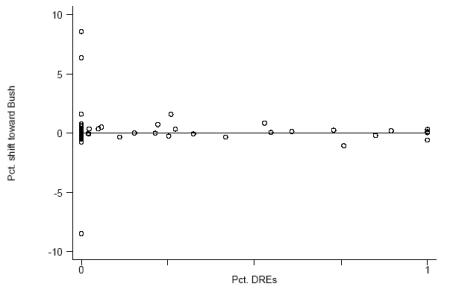
Figures 1, 2 and 3 show plots of the percentage shift toward Bush, from the exit polls to the official count, against the fraction of votes counted using paper ballots, mechanical lever machines, and DREs. There is no discernible pattern consistent with the various electionstealing hypotheses. One’s eye is immediately drawn to three outliers, which is the only reason we find any relationship at all. In Figure 2, which shows the relationship between the pro-Bush shift in the official count results and the usage of mechanical lever machines, New York dominates the pattern. It is the outlier state on both dimensions --- the only state that counts 100% of its votes on mechanical lever machines and the state with the largest pro-Bush shift.
Given the overall pattern in Figure 2, this seems like a matter of bad luck, rather than evidence of a stolen election.
Conclusion
There is no evidence that electronic voting machines were used to steal the 2004 election for George Bush. The “facts” that are being circulated on the Internet appear to be selectively chosen to make the point. Much of that analysis appears to rest on early exit poll results, which were bound to be highly volatile, given the nature of exit poll methodology.
This episode of trying to rely on the exit polls to verify the truthfulness of voting machines illustrates the weakness of this approach --- an approach that had gained currency among electronic voting opponents before the November election. Even when they work well, exit polls are too imprecise to lay against the official count, unless every voter is included in the exit poll. The following exchange between a questioner in an on-line chat and Steve Coll, Managing Editor of the Washington Post, sums up the problem nicely:
Q: Is anyone going to correlate exit-poll errors with precincts that use the new electronic voting machines to see if there's a pattern, to wit: in precincts where there's no paper trail and no way of conducting a recount, Bush outdid expectations; in other precincts, results more or less matched exit polls? I'm not saying this is the case, but as someone who felt slimed by Florida in 2000, I'd like someone to pause long enough (it's less than 24 hours after the polls closed!) to make sure we're not seeing another stolen election. I'd rather not have to wait until Jeffrey Toobin's next book to discover I've been slimed again.A: Well, I don't want to write off legitimate questions about the integrity of the voting system. But turn the question around: Which is more likely -- that an exit
5
polling system that has been consistently wrong and troubled turned out to be wrong and troubled again, or that a vast conspiracy carried out by scores and scores of county and state election officials was successfully carried off to distort millions of American votes? I think the Kerry campaign concluded that the former is what happened. But we'll keep our eyes open for hard evidence of abuse, and we won't be afraid to investigate if we see something significant.
6
Figure 1. Shift toward Bush from the exit polls to the official count, plotted against the percentage of votes counted on various kinds of paper ballots.

Figure 2. Shift toward Bush from the exit polls to the official count, plotted against the percentage of votes counted on mechanical lever machines.

Figure 3. Shift toward Bush from the exit polls to the official count, plotted against the percentage of votes counted on DREs.


 Deep Sea Mining Campaign: New Report Exposes Impossible Metals’ Claims As Scientifically Baseless
 Pacific Whale Fund: First Māori Voice Opens UN Oceans Conference, Pushing For Marine Legal Rights
 International AIDS Society: IAS Announces Rio De Janeiro As Host City For AIDS 2026
 Our Schools: Trump And Republicans Want Taxpayers To Fund Their Pet Project - Private Schools
 Science Media Centre: Dengue In The Pacific Region – Expert Q&A
 New Zealand Defence Force: NZDF Prepares For Major Warfighting Exercise In Australia