 Scoop has an Ethical Paywall


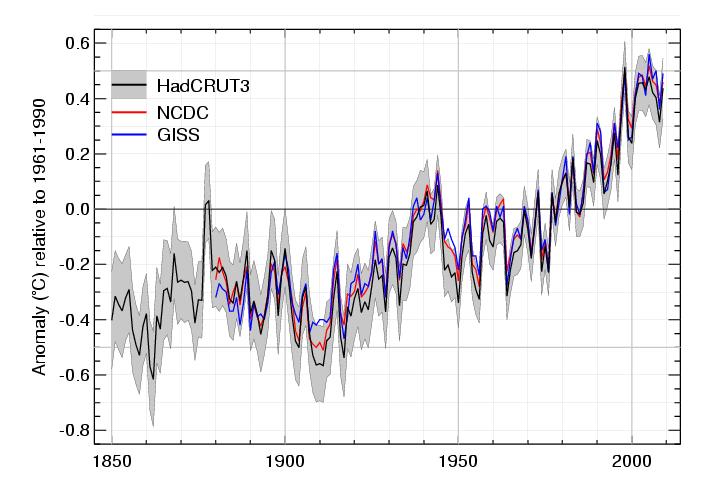
2000–2009, The Warmest Decade
Click to enlarge
Result from three Global datasets: NOAA (NCDC Dataset) , NASA (GISS dataset) and combined Hadley Center and Climate Research Unit of the University of East Anglia (UK) (HadCRUT3 dataset)
Press Release
No.869
For use of the information
media
Not an official
record
2000–2009, The Warmest
Decade
Geneva, 8 December 2009 (WMO) – The
year 2009 is likely to rank in the top 10 warmest on record
since the beginning of instrumental climate records in 1850,
according to data sources compiled by the World
Meteorological Organization (WMO). The global combined sea
surface and land surface air temperature for 2009
(January–October) is currently estimated at 0.44°C ±
0.11°C (0.79°F ± 0.20°F) above the 1961–1990 annual
average of 14.00°C/57.2°F. The current nominal ranking of
2009, which does not account for uncertainties in the annual
averages, places it as the fifth-warmest year. The decade of
the 2000s (2000–2009) was warmer than the decade spanning
the 1990s (1990–1999), which in turn was warmer than the
1980s (1980–1989). More complete data for the remainder of
the year 2009 will be analysed at the beginning of 2010 to
update the current assessment.
This year above-normal temperatures were recorded in most parts of the continents. Only North America (United States and Canada) experienced conditions that were cooler than average. Given the current figures, large parts of southern Asia and central Africa are likely to have the warmest year on record.
Climate extremes, including devastating floods, severe droughts, snowstorms, heatwaves and cold waves, were recorded in many parts of the world. This year the extreme warm events were more frequent and intense in southern South America, Australia and southern Asia, in particular. La Niña conditions shifted into a warm-phase El Niño-Southern Oscillation (ENSO) in June. The Arctic sea ice extent during the melt season ranked the third lowest, after the lowest and second-lowest records set in 2007 and 2008, respectively.
This preliminary information for 2009 is based on climate data from networks of land-based weather and climate stations, ships and buoys, as well as satellites. The data are continuously collected and disseminated by the National Meteorological and Hydrological Services (NMHSs) of the 189 Members of WMO and several collaborating research institutions. The data continuously feed three main depository global climate data and analysis centres, which develop and maintain homogeneous global climate datasets based on peer-reviewed methodologies. The WMO global temperature analysis is thus based on three complementary datasets. One is the combined dataset maintained by both the Hadley Centre of the UK Met Office and the Climatic Research Unit, University of East Anglia, United Kingdom. Another dataset is maintained by the National Oceanic and Atmospheric Administration (NOAA) under the United States Department of Commerce, and the third one is from the Goddard Institute of Space Studies (GISS) operated by the National Aeronautics and Space Administration (NASA). The content of the WMO statement is verified and peer-reviewed by leading experts from other international, regional and national climate institutions and centres before its publication.
Final updates and figures for 2009 will be published in March 2010 in the annual WMO Statement on the Status of the Global Climate.
Regional temperature anomalies
The year 2009 (January–October) was again warmer than the 1961–1990 average all over Europe and the Middle East. China had the third-warmest year since 1951; for some regions 2009 was the warmest year. The year started with a mild January in northern Europe and large parts of Asia, while western and central Europe were colder than normal. Russia and the Great Lakes region in Canada experienced colder-than- average temperatures in February and January, respectively. Spring was very warm in Europe and Asia; April in particular was extremely warm in central Europe. Germany, the Czech Republic and Austria reported temperature anomalies of more than +5°C, breaking the previous records for the month in several locations. The European summer was also warmer than the long-term average, particularly over the southern regions. Spain had the third-warmest summer, with hotter summers reported only in 2003 and 2005. Italy recorded a strong heatwave in July, with maximum temperatures above 40°C, and some local temperatures reaching 45°C. A heatwave at the beginning of July affected the United Kingdom, France, Belgium and Germany, and some stations in Norway experienced new maximum temperature records.
India had an extreme heatwave event during May, which caused 150 deaths. A heatwave hit northern China during June, with daily maximum temperatures above 40°C; historical maximum temperature records were broken for the summer in some locations.
In late July many cities across Canada recorded their warmest daily temperatures. Vancouver and Victoria set new records, reaching 34.4°C and 35.0°C, respectively. Alaska also had the second-warmest July on record. Conversely, October was a very cold month across large parts of the United States. For the nation as a whole, it was the third-coolest October on record, with an average temperature anomaly of -2.2°C (-4.0°F). Similarly, a very cold October was reported in Scandinavia, with mean temperature anomalies ranging from -2°C to -4°C.
The austral autumn (March to May) was extremely warm in Argentina, Uruguay, Paraguay and southern Brazil. With daily temperatures ranging from 30°C to 40°C, several records were broken during this season. By the end of October, an extreme weather situation affected north and central Argentina, producing unusually high temperatures (above 40°C). Conversely, November was abnormally cold in the southern part of the region, with some rare and late snowfalls.
So far, Australia has had the third-warmest year on record. The year 2009 was marked by three exceptional heatwaves, which affected south-eastern Australia in January/February and November, and subtropical eastern Australia in August. The January/February heatwave was associated with disastrous bushfires that caused more than 173 fatalities. Victoria recorded its highest temperature with 48.8°C. The northern region experienced a cold summer, however, with anomalies reaching -3°C to -4°C in some places. Winter was exceptionally mild over much of Australia. Maximum temperatures were well above normal across the entire continent, reaching 6°C to 7°C above normal in some parts. The national maximum temperature anomaly of +3.2°C was the largest ever recorded for any month.
Severe droughts
China suffered its worst drought in five decades. Water levels in parts of the Gan River and Xiangjiang River were the lowest in the past 50 years. In India the poor monsoon season caused severe drought impacts in 40 per cent of the districts. The north-western and north-eastern parts of the country were badly affected. It was reported to be one of the weakest monsoon seasons since 1972.
In East Africa the drought led to massive food shortages. In Kenya the drought was responsible for severe damage to livestock and a 40 percent decline in the maize harvest.
In North America, Mexico experienced severe-to-exceptional drought conditions by the month of September. In the United States, the western region was the most affected by a moderate-to-exceptional drought by the end of October. Nevertheless, the total area affected by drought in the United States during October was the second-smallest value recorded in this decade.
Drought in Central Argentina caused severe damage to agriculture, livestock and water resources. The situation was most severe at the end of October, with very high temperatures reported as well.
Over the key agricultural areas of the Murray-Darling Basin and the south-western part of Western Australia, rainfall was generally below normal. The passage of another year without any sustained above-normal rainfall has seen long-term rainfall deficits continuing in south-eastern Australia. Sustained dry conditions in the Murray-Darling Basin have now continued for nine years.
Intense storm events and precipitation
At the end of January, Spain and France were severely affected by winter storm Klaus, the worst extra-tropical storm in a decade, with winds similar to a category 3 hurricane. Another winter storm combined with heavy snowfall caused severe damage in western Europe and resulted in serious disruptions of air and rail traffic in several countries. In late spring and summer a large number of thunderstorms with heavy rain, hail and tornadoes caused local flooding and significant damage across Germany. In September, several parts of the Mediterranean region were affected by extreme rainfall events. Total rainfall of more than 300mm was recorded in less than 48 hours in one location of south-eastern Spain, where the long-term average for total annual precipitation does not exceed 450 mm. During the same month, intense rainfall caused devastating damage to infrastructure in several parts of northern Africa, including Algeria, Morocco and Tunisia. In a similar pattern, the highest September rainfall recorded in 80 years produced severe flash floods in north-western Turkey. November brought severe flooding to northern areas of the United Kingdom, and a new 24-hour precipitation record was set for the country.
During the beginning of the year heavy rainfall was observed in Colombia, producing landslides and widespread floods. North-east Brazil was severely affected by heavy rainfall and flooding in April and May. Later, in July, a severe snowstorm hit the southern part of Argentina; it was the worst snowstorm in 15 years. During the austral spring, particularly in November, continuous heavy and intense rainfall was seen in north-eastern Argentina, southern Brazil and Uruguay, causing flooding in many places and affecting more than 15,000 people. Total monthly precipitation records were broken, with rainfall exceeding more than 500mm in many locations.
In Canada, Ontario experienced a record number of witnessed tornadoes and a record number of related fatalities. Canadian avalanches were almost double the yearly average for the past decade and the worst since 2002–2003. A total of 25 deaths made it one of the deadliest seasons. The northern plains region of the United States was affected by record flooding during the month of March. As a whole, the United States recorded the wettest October in 115 years.
In Central America, an intense storm in El Salvador in November, associated in part with Hurricane Ida, produced deadly floods and landslides that claimed 192 lives.
In Asia, after the weak 2009 monsoon season, southern India recorded severe flooding due to incessant rain in late September and the first week of October, and more than 250 lives were lost. On the other hand, northern China was severely affected by a snowstorm that occurred during the first half of November as part of a strong cold wave. These snowfalls were one month earlier than normal, breaking local weather records.
In western Africa, heavy and intense rainfall in September caused flooding that affected more than 100,000 people. The worst flooding was observed in Burkina Faso, where 263 mm of rain was recorded in less than 12 hours, breaking a record set 90 years ago. Further south on the continent, nearly 1 million people in Zambia and Namibia were affected by torrential rain that caused rivers to overflow their banks, flooding homes and cropland.
Australia was also affected by local flooding. Coastal Queensland and New South Wales were the hardest hit by several heavy rain events, with daily rainfall totals in excess of 300 mm. On the other hand, numerous duststorms affected eastern Australia in the second half of September and early October, as regular strong winds transported dust from northern South Australia over the eastern states. The most severe duststorm occurred on 22–23 September and covered large parts of New South Wales and Queensland, where the visibility was reduced to 100–200m in both Sydney and Brisbane.
End of La Niña and Development of El Niño
La Niña-like conditions were present in early 2009, followed by the development of El Niño patterns starting in June 2009. During June–September 2009, sea surface temperatures were generally about 1°C warmer than the long-term average across the central and eastern equatorial Pacific. An El Niño event is currently underway, with the early phase of the event holding steady at weak-to-moderate levels through July–September. During October, almost all indicators of El Niño became noticeably stronger.
Tropical cyclone season
The 2009 Atlantic hurricane season closed with the fewest named storms and hurricanes since 1997, most likely due to the unfavourable cyclonic conditions caused in part by El Niño. A total of nine named tropical storms were formed, including three hurricanes, two of which were major hurricanes at Category 3 strength or higher. (The averages are 11, 6 and 2, respectively).
In the East Pacific, 20 named tropical storms were recorded, eight of which evolved into hurricanes and five of which became major hurricanes (The averages are 16, 9 and 4, respectively.)
In the western North Pacific, 22 named tropical storms have been recorded so far, and 13 of them reached the intensity of typhoon, compared to the long-term averages of 27 and 14, respectively. Heavy precipitation associated with typhoons Ketsana and Parma was observed across the south of Luzon Island in the Philippines. The resulting flood disaster caused more than 900 fatalities in total. In August, Typhoon Morakot swept across Taiwan Province of China and caused more than 400 deaths and severe damage to agriculture and infrastructure. Hundreds of roads and bridges on the island were destroyed by floods.
The Australian and South Indian Ocean cyclone seasons recorded near-average activity. In the Australian region, there were 10 systems during this season, with Hamish the most significant one, although it did not make landfall. It reached category 5 intensity and was the most intense cyclone observed off the eastern Queensland coast since 1918.
Third-lowest Arctic sea ice
According to scientific measurements, Arctic sea ice has declined dramatically over the past 30 years at least, with the most extreme decline seen in the summer melt season. Arctic sea ice extent during the 2009 melt season was 5.10 million km2, which is the third-lowest on record after the 2007 record (4.3 million km2) and 2008 (4.67 million km2), since satellite measurements began in 1979.
Information sources
This press release was issued in collaboration with the Hadley Centre of the United Kingdom Meteorological Office; the Climatic Research Unit, University of East Anglia, United Kingdom; the National Climatic Data Center, National Environmental Satellite and Data Information Service, and the National Weather Service under NOAA; and the National Snow and Ice Data Center in the United States. Other contributors are the NMHSs of Algeria, Argentina, Australia, Brazil, Canada, China, Colombia, Finland, France, Germany, Iceland, India, Japan, Morocco, Spain, Sweden, Tunisia, Turkey and Uruguay. The African Centre of Meteorological Applications for Development (ACMAD, Niamey), the Australian Commonwealth Scientific and Industrial Research Organization (CSIRO), the Centro Internacional para la Investigación del Fenómeno de El Niño (CIIFEN, Guayaquil, Ecuador), the Intergovernmental Authority on Development (IGAD) Climate Prediction and Applications Centre (ICPAC, Nairobi, Kenya), the Southern African Development Community (SADC) Drought Monitoring Centre (SADC DMC, Gabarone, Botswana) and the World Climate Research Programme (WCRP) also contributed.
Global Surface Temperature Trend : Result from three Global datasets: NOAA (NCDC Dataset) , NASA (GISS dataset) and combined Hadley Center and Climate Research Unit of the University of East Anglia (UK) (HadCRUT3 dataset)
WMO is the United
Nations System’s authoritative voice on weather, climate
and water.
ENDS
 Master Plumbers Gasfitters and Drainlayers NZ: New Consumer NZ Test Reveals Danger Of Unregulated Online Plumbing Products
 Mindful Money: Winners At The Mindful Money Annual Ethical & Impact Investment Awards 2025
 MBIE: Gas Supply Reducing Faster And Sooner Than Previously Forecast
 Natural Hazards Commission: International Markets Show Unprecedented Confidence In NZ’s Natural Hazards Insurance Scheme
  ASB Bank: ASB Business Survey - The Impact Of Trump's Tariffs, According To Kiwi Businesses
 University of Auckland: Will Robots Help Older People Stay Sharp?