Net migration remains high
Annual net migration has remained at high levels since the December 2014 year, Stats NZ said today.
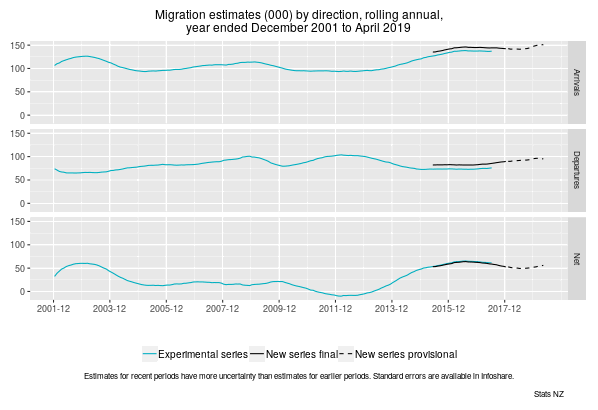
“Since late 2014, annual net migration has ranged between 48,000 and 64,000,” population indicators manager Tehseen Islam said.
“The only previous time net migration was at these levels was for a short period in the early 2000s.”
Migrant arrivals were provisionally estimated at 151,000 (± 1,500) and migrant departures at 95,100 (± 1,200) in the 12 months ended April 2019. This resulted in a provisional estimate of annual net migration of 55,800 (± 1,600).

Text alternative for Migration estimates (000) by direction, rolling annual, year ended December 2001 to April 2019
Revisions to previous estimates
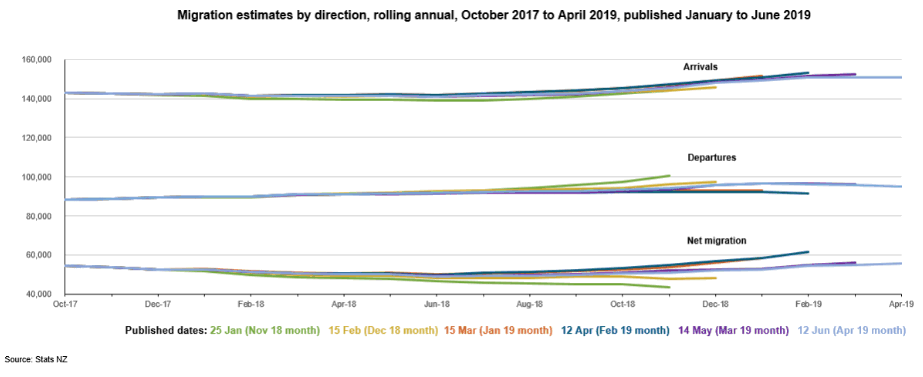
Revisions for migrant arrivals and departures in recent months have resulted in slightly lower annual net migration compared with earlier provisional estimates.
There may be upward and downward revisions, but the revisions for a given month generally become smaller over time as fewer border movements require modelling. However, this pattern may be affected by the seasonality in the volume and composition of border movements.

Text alternative for Migration estimates by direction, rolling annual, October 2017 to April 2019, published January to June 2019
Year ended November 2018
Annual arrival and departure data are subject to notably less revision at 5–6 months after the reference period. By this time there is more certainty about whether travellers are short-term or long-term (migrants), according to the 12/16-month rule.
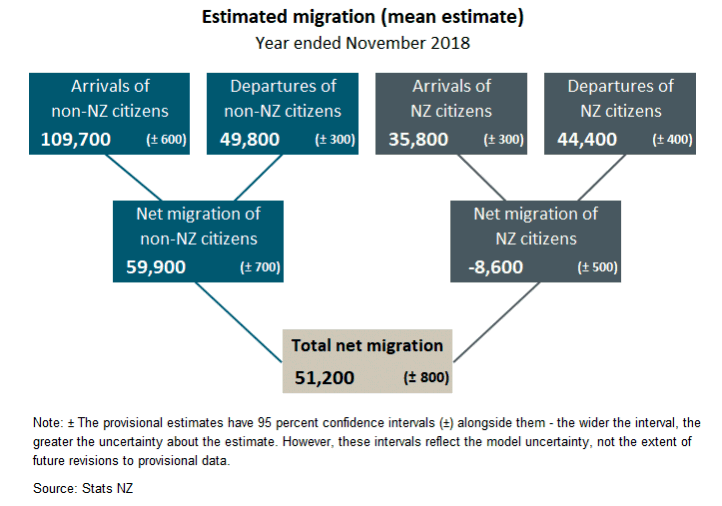
The latest revised provisional estimate of net migration for the November 2018 year is 51,200 (± 800). Migrant arrivals are provisionally estimated at 145,500 (±700) and migrant departures at 94,200 (± 500).
About three-quarters of migrant arrivals were non-New Zealand citizens (109,700 ± 600) in the November 2018 year. Over the same period, just over half of migrant departures were non-New Zealand citizens.
More New Zealand citizens left the country long-term than returned – leading to an estimated net loss of 8,600 (± 500) New Zealand citizens in the November 2018 year.

Text alternative for Estimated migration (mean estimate) year ended November 2018
In the
November 2018 year, the provisional migration estimates by
country of last permanent residence showed:
• 19
percent of migrant arrivals were from Australia, of which 64
percent were New Zealand citizens and 25 percent were
Australian citizens
• 11 percent were from
China
• 10 percent were from India
• 8 percent
were from the United Kingdom.
Final migration figures year ended December 2017
Migration estimates are revised each month until they are finalised after 16 months.
Migration estimates up to December 2017 are now final. The final net migration for the year ended December 2017 was 52,600. Migrant arrivals were 142,300 and migrant departures were 89,700.
Text alternative for graph, Migration estimates (thousands) by direction, rolling annual, year ended December 2001 to April 2019
Three time-series line graphs show outcomes-based estimates for migrant arrivals, migrant departures, and net migration, from rolling annual years ended December 2001 to April 2019 – for experimental series and new series. The graphs show final estimates from May 2015 to December 2017, and provisional estimates from January 2018 to April 2019, for the new series of migration. An experimental series for December 2001 to June 2017 gives a longer time series.
Text alternative for graph, Migration estimates by direction, rolling annual, October 2017 to April 2019, published January to June 2019
Time series line graph showing rolling annual migration estimates for migrant arrivals, migrant departures, and net migration, from October 2017 to April 2019.
The graph illustrates the impact of revisions on previously published data. Revisions for migrant arrivals and departures in recent months have resulted in slightly lower annual net migration compared with earlier provisional estimates.
Text alternative for diagram, Estimated migration (mean estimate), year ended November 2018
Diagram shows estimates for migrant arrivals, migrant departures, and net migration, for the year ended November 2018. Arrivals of non-New Zealand citizens were 109,700 (± 600) and departures were 49,800 (± 300), making a net migration gain of 59,900 (± 700) non-New Zealand citizens. Arrivals of New Zealand citizens were 35,800 (± 300) and departures were 44,400 (± 400), making a net migration loss of 8,600 (± 500) New Zealand citizens. Result is a total net migration gain of 51,200 (± 800). Note: The provisional estimates have 95 percent confidence intervals (±) alongside them – the wider the interval, the greater the uncertainty about the estimate. However, these intervals reflect the model uncertainty, not the extent of future revisions to provisional data.
Ends
The Government Statistician authorises all statistics and data we publish.
For more
information about these statistics:
• Visit International migration: April
2019
• See CSV files for
download
• Open the attached files
internationalmigrationapril2019.xlsx
internationalmigrationapril2019comparisonofprovisionalandfinal_migrationestimates.xlsx


 Gordon Campbell: On The New Pope, And The Israeli Attack On Peter Davis
 New Zealand Police: Statement Regarding Jevon McSkimming
 Climate Liberation Aotearoa: Climate Activist Draw Attention To Outdated Regulations Of Heli Tourism In Aoraki National Park
 The New Zealand Remembrance Army: Victoria Cross And Hardham Cup Come Together For First Time In Over 100-years
 Queer Endurance in Defiance: Wellington Queer Communities Protest Against NZ First’s Anti-Trans Bill
 Water New Zealand: Stormwater 2025 - Tackling Flooding And Storms To Build A Climate-Resilient Future
 New Zealand Labour Party: Labour Asks Why Govt Is Silent On Gaza


