 Scoop has an Ethical Paywall


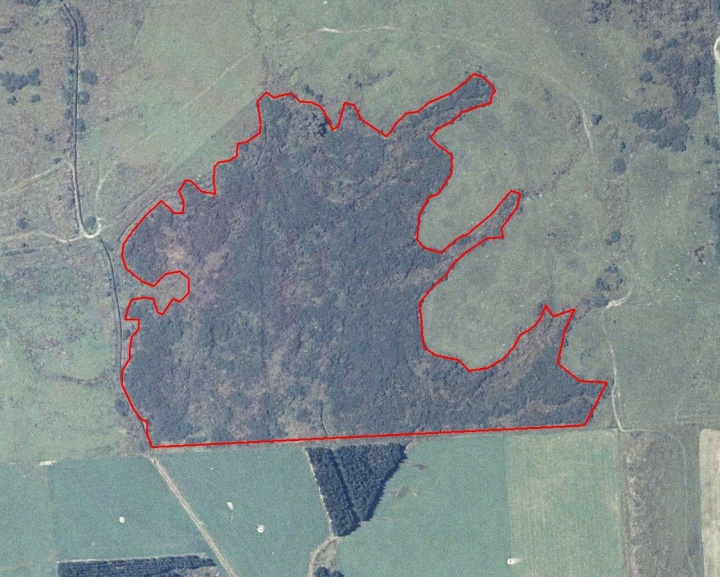
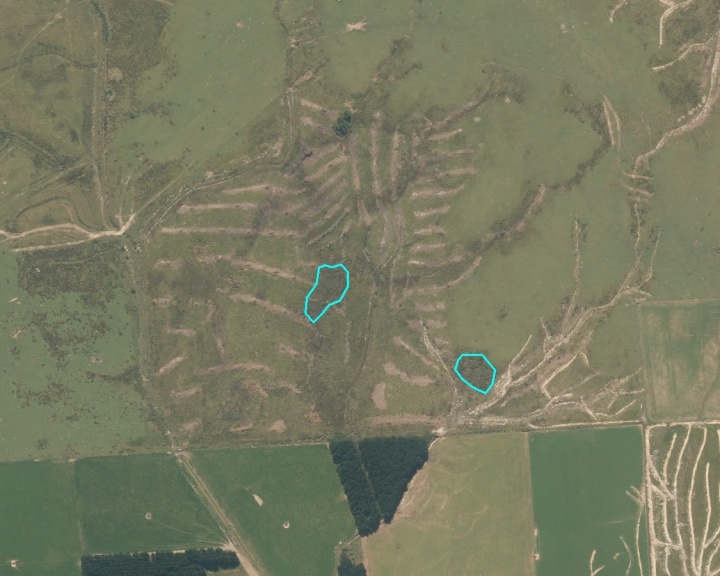
Aerial images show wetlands on private land disappearing
Aerial images show wetlands on private land disappearing at alarming rate
To mark World Wetlands Day (February 2),
Forest & Bird is releasing aerial images of wetlands disappearing
on private land at an alarming rate.
The images, taken in Southland, show a number of wetlands on private land completely or partly disappearing in the seven years from 2007-2014.
“This is our national shame. The rate and extent of wetland destruction in New Zealand has been recognised as among the highest in the world,” says Annabeth Cohen, Forest & Bird’s Freshwater Advocate.
Ms Cohen says wetlands on private land are most in danger of being drained and destroyed. “New Zealanders may think wetland loss is a thing of the past, but recent reports confirm that we are still losing wetlands every day.”
“Forest & Bird estimates a third of our remaining wetlands are on private land – we are in real danger of losing these special places unless the government does something meaningful this year.”
Ms Cohen says wetlands play a vital ecological role, providing unique habitat for threatened plants, birds, and fish. A fifth of native bird species use wetlands as their primary habitat.
Since 2001, at least 13 percent of New Zealand's freshwater wetlands, have been damaged or destroyed. This includes 214 wetlands that are completely gone and another 746 that were partially destroyed between 2001-2015.[1]
Ms Cohen says national regulations are inadequate to protect wetlands. As a result, regional council plans are highly inconsistent and some allow wetlands to be drained, cleared of vegetation, or opened up to livestock.
“As we mark World Wetlands Day, we’re calling on the government to show leadership. Environment Minister David Parker needs to stop any further destruction by requiring regional councils to map and protect their wetlands.”
“We also call on the Minister to set a goal for councils to double the wetlands in their region, by restoring wetlands that have been degraded and destroyed.”
A recent study on wetland loss in New Zealand is the first to categorise wetlands as ‘at risk’ of being destroyed due to the presence of drainage channels (as seen in the aerial images).[2] This drainage work is often associated with the increase in dairy farming.
The theme of this year’s World Wetlands Day recognises the significant role wetlands play in fighting climate change.
“Healthy wetlands will help protect people and wildlife from the impacts of climate change," says Ms Cohen. “They act as coastal buffers, shielding our lowlands from storm surges. They reduce floods and relieve droughts, as well as absorbing and storing carbon.”
“We need every single wetland we’ve got—and more—if our native bird and fish species are going to stand a chance in the face of climate change.”
The aerial images were prepared for a report for Environment Southland by Richard Ewans, Eco-South, and have been shared with permission from Environment Southland.
Background
notes
• Less than 10 percent of New
Zealand’s original extent of wetlands remain.
• There
are no figures indicating national wetland destruction since
2015.
• The National Policy Statement (NPS) on
Freshwater Management is being reviewed by Minister David
Parker this year and is the most immediate opportunity to
strengthen wetland protection.
• A draft NPS on
Indigenous Biodiversity has been developed by key
stakeholders (including Forest & Bird) and presented to
Minister Nanaia Mahuta and would also provide much greater
protections for wetlands.
Table 1: Forest & Bird, QGIS estimation of total freshwater wetlands (ha) and private land wetlands (ha) per region and nationally. This data will contain a degree of inaccuracy due to the imprecise knowledge of wetlands on private land. See data sources below.
Region Total freshwater
wetlands (Ha) Private land
(Ha) Private land (%)
Auckland
Region 2483 1,800 72%
Bay of Plenty
Region 3254 2,532 78%
Canterbury
Region 19340 9,189 48%
Gisborne
Region 903 874 97%
Hawke's Bay
Region 2438 2,354 97%
Manawatu-Whanganui
Region 6925 4,855 70%
Marlborough
Region 1307 691 53%
Nelson - Tasman
Region 5137 805 16%
Northland
Region 14052 6,529 46%
Otago
Region 23784 10,983 46%
Southland
Region 46825 11,107 24%
Taranaki
Region 2949 1,550 53%
Waikato
Region 27857 10,573 38%
Wellington
Region 2752 1,573 57%
West Coast
Region 83971 12,118 14%
National 243976 77,533 32%
Regional
highlights:
• Since 2001,
more than 15 percent of wetlands in Auckland, Waikato,
Gisborne, Manawatu-Whanganui, Wellington, Marlborough, and
Canterbury have been damaged (reduced in size) or
destroyed.
• Wellington has damaged (reduced in size)
the greatest proportion of its wetlands since 2001 (over 37
percent)
• West Coast is the largest wetland region in
New Zealand, and has damaged the largest area of wetlands in
hectares. Nearly 11,000 hectares have reduced in size since
2001.
• Canterbury has damaged the second largest area
of wetlands since 2001. Nearly 6,000 hectares of wetlands
have reduced in size.
• Both Waikato and Southland have
damaged around 4,000 hectares of wetlands each since
2001.
Region by region
Northland
• Since
2001, seven percent of wetlands (just under 1,000 hectares)
have been partially destroyed (reduced in
size).
• Forest & Bird estimates that there are about
6,500 hectares (46 percent) of wetlands on private
land.
Auckland
• Since
2001, 20 percent of wetlands (just over 5,000 hectares) have
been partially destroyed (reduced in size).
• Forest &
Bird estimates that there are approximately 1,800 hectares
(72 percent) of wetlands on private
land.
Waikato
• Since
2001, 15 percent of wetlands (just over 4,200 hectares) have
been partially destroyed (reduced in size).
• Forest &
Bird estimates that there are about 10,600 hectares (38
percent) of wetlands on private land.
Bay of
Plenty
• Since 2001, eight
percent of wetlands (just over 250 hectares) have been
partially destroyed (reduced in size).
• Forest & Bird
estimates that there are about 2,500 hectares (78 percent)
of wetlands on private land.
Hawke’s
Bay
• Since 2001, three
percent of wetlands (just over 80 hectares) have been
partially destroyed (reduced in size).
• Forest & Bird
estimates that there are about 2,300 hectares (97 percent)
of wetlands on private
land.
Gisborne
• Since
2001, 18 percent of wetlands (170 hectares) have been
partially destroyed (reduced in size).
• Forest & Bird
estimates that there are about 870 hectares (97 percent) of
wetlands on private
land.
Taranaki
• Since
2001, eight percent of wetlands (230 hectares) have been
partially destroyed (reduced in size).
• Forest & Bird
estimates that there are about 1,600 hectares (53 percent)
of wetlands on private
land.
Manawatu-Whanganui
• Since
2001, 17 percent of wetlands (nearly 1,200 hectares) have
been partially destroyed (reduced in size).
• Forest &
Bird estimates that there are about 4,900 hectares (70
percent) of wetlands on private
land.
Wellington
• Since
2001, 37 percent of wetlands (1,000 hectares) have been
partially destroyed (reduced in size).
• Forest & Bird
estimates that there are about 1,600 hectares (57 percent)
of wetlands on private land.
Nelson &
Tasman
• Since 2001, four
percent of Tasman wetlands (over 180 hectares) have been
partially destroyed (reduced in size).
• Nelson only
has 3 hectares of wetlands currently.
• Forest & Bird
estimates that there are about 800 hectares (16 percent) of
wetlands on private land in the Nelson and Tasman areas
combined.
Marlborough
• Since
2001, 20 percent of wetlands (just over 300 hectares) have
been partially destroyed (reduced in size).
• Forest &
Bird estimates that there are about 690 hectares (53
percent) of wetlands on private
land.
Canterbury
• Since
2001, 29 percent of wetlands (just over 5,800 hectares) have
been partially destroyed (reduced in size).
• Forest &
Bird estimates that there are about 9,200 hectares (48
percent) of wetlands on private land.
West
Coast
• Since 2001, twelve
percent of wetlands (over 10,700 hectares) have been
partially destroyed (reduced in size).
• Forest & Bird
estimates that there are about 12,100 hectares (14 percent)
of wetlands on private
land.
Otago
• Since
2001, nine percent of wetlands (2,300 hectares) have been
partially destroyed (reduced in size).
• Forest & Bird
estimates that there are about 11,000 hectares (46 percent)
of wetlands on private
land.
Southland
• Since
2001, eight percent of wetlands (nearly 4,000 hectares) have
been partially destroyed (reduced in size).
• Forest &
Bird estimates that there are about 11,100 hectares (24
percent) of wetlands on private land.
Sources Reports
• Belliss,
S, Shepherd, J, Newsome, P, & Dymond, J (2017). An analysis of wetland loss between 2001/02
and 2015/16. Landcare Research Contract Report
LC2798 for the Ministry for the Environment.
• Ewans,
Richard. Environment Southland Wetland Inventory and
Monitoring Project: Monitoring Wetland Extent Outside of
Public Conservation Land and Assessment of Wetland Status in
the Southland Region. Eco-South and Environment
Southland, 2018.
• Myers, Shona C. A Biodiversity
Planning Snapshot - How Well Are Councils Protecting
Biodiversity? NZ Ecological Society Conference,
Wellington 2018.
• Myers, S.C., et al. Wetland
Management in New Zealand: Are Current Approaches and
Policies Sustaining Wetland Ecosystems in Agricultural
Landscapes? Ecological Engineering, vol. 56, 2013, pp.
107–120.,
doi:10.1016/j.ecoleng.2012.12.097.
• Robertson, Hugh,
et al. Loss of Wetlands since 1990 in Southland, New
Zealand. New Zealand Journal of Ecology, 2018,
doi:10.20417/nzjecol.43.3.
• StatsNZ. http://archive.stats.govt.nz/browse_for_stats/environment/environmental-reporting-series/environmental-indicators/Home/Fresh%20water/wetland-extent.aspx
Data Sources for Forest & Bird QGIS calculations
in Table 1
DOC Public Conservation Areas: https://koordinates.com/layer/754-doc-public-conservation-areas/
LINZ
Managed Crown Properties: https://koordinates.com/from/data.linz.govt.nz/layer/53358/
Wetland
extent, 2001-2016 (used for calculation): https://koordinates.com/from/data.mfe.govt.nz/layer/95347/
Current
wetland extent, 2013 (used for visual comparison):https://koordinates.com/from/data.mfe.govt.nz/layer/52676/
________________________________________
[1] Belliss, S, Shepherd, J, Newsome, P,
& Dymond, J (2017). An analysis of wetland loss between 2001/02
and 2015/16. Landcare Research Contract Report
LC2798 for the Ministry for the Environment.
[2] Robertson, Hugh, et al. Loss of
Wetlands since 1990 in Southland, New Zealand. New
Zealand Journal of Ecology, 2018,
doi:10.20417/nzjecol.43.3.
 Gordon Campbell: On The Rise Of Simeon Brown
 Green Party: Aotearoa Must Step Up As Trump Plays With Climate Fire
 Extinction Rebellion Tāmaki Makaurau: Fossil Of The Day Award Presented At The Climate Ministers Office
 NZ Customs Service: Customs Arrests Passenger For 31 Kgs Of Methamphetamine In Suitcases
 PSA: Shuffling Ministers Ignores Need To Increase Funding For Health And The Public Service
 Te Pāti Māori: Polls Over Fixing Health Crisis
 NZ Labour Party: Cabinet Reshuffle A Futile Exercise From Failing Government