 Scoop has an Ethical Paywall


It doesn’t have to be like this
It doesn’t have to be like this
The New Zealand Council of Trade Unions (NZCTU) knows that the reality facing workers and their families is a hash one. But it doesn’t have to be this way.
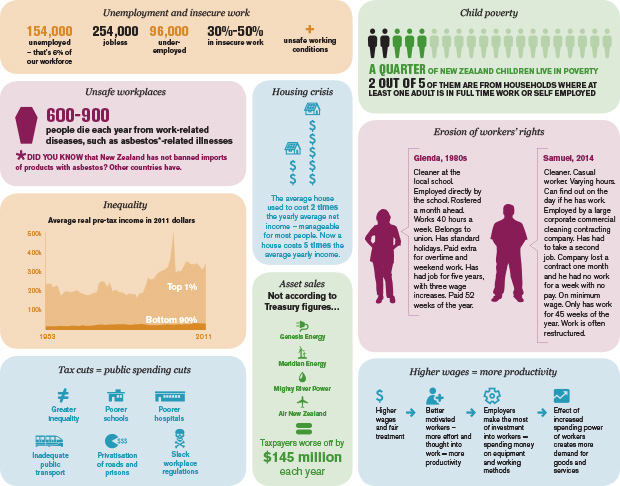
To illustrate the current situation we have pulled together a significant amount of research into 10 areas of importance, we’ve then condensed the information down into bite size pieces and used the power of pictures to convey the detail of what is happening through infographics. Each of our 10 tops has its own infograph. We’ve then pulled out a salient point from nine of these topics to create the infographic above – a summary infograph.
The picture is bleak. Alternatives are possible.
Just vote.
DYING ON THE JOB Decades of deregulation
have made New Zealand a dangerous places to work
The 2010 tragedy at Pike River Mine laid bare the appalling truth about New Zealand’s work environments: they have some of the worst death and injury rates of any Western nation.
Every year, on average 75 people are killed at work, and there are as many as 400 further “serious” injuries. One in every ten workers is injured every year, leading to around 200,000 claims being made to ACC. The cost of workplace accidents is conservatively estimated at $3.5 billion each year.1
In addition, 600-900 people die from work-related diseases such as asbestos-related illnesses.2 This shocking figure, which gains relatively little attention, is equivalent to two-three times our annual road toll.3
Asbestos – which has been known to cause cancer since the mid-1980s – is one of the most dangerous elements of our workplaces. Workers on the Christchurch rebuild, in particular, are being exposed to harmful levels of asbestos. New Zealand should be banning imports of products with asbestos (as other countries do) and working to eliminate it from the country entirely by 2030 – yet the government is dragging its heels over the issue.4
At a global level, many more people die at work in New Zealand than they do in countries like Australia and
Britain (adjusting for country size) – and their records have been improving much more quickly than ours.
In real terms the average wage today (March 2014, ordinary time and overtime combined) is just 11.5% higher than it was in March 1982, before Muldoon’s “freeze” and the Bolger Government’s anti-union Employment Relations Act. Over thirty-two years that’s an average increase of one-tenth of 1% a year. Meanwhile real GDP per capita has increased 52%. The lion’s share of the gains from growth have gone to capital, not labour.
New Zealand has moved from being a high-wage economy to becoming a low-wage economy. Since the 1980s
• real wages have fallen further and further behind the growth of the economy
• the labour share of the nation’s income has fallen from 60% to 50%,
• productivity gains have not been passed through to wages
• workers’ ability to organise and bargain to raise wages has been stripped away by anti-union legislation
• economic policy has led to an unbalanced economy in which job creation has been dominated by low wage insecure work, mainly in services industries
• half of New Zealand’s households receive no more income in real terms than a generation ago.
In theory, wages should rise as fast as labour productivity. New Zealand’s wage rises since 1989 have lagged far behind productivity growth. Measured labour productivity rose 58 percent between 1989 and 2013. The real average hourly wage (all industries, ordinary time plus overtime, purchasing power measured by the Consumer Price Index) rose just 18 percent.
Jobs should work for everyone, but they increasingly serve the needs of employers, not employees. In New Zealand’s law and internationally it is recognised that employers have much greater power than workers in employment relationships. This was made more extreme with the opening the economy from the 1980s, enabling employers to threaten to move jobs to low-wage countries or use imports from those countries. At the same time, unemployment benefits and other social supports were slashed, leaving many people who find themselves out of work faced with the choice between poverty and an unsuitable job.
It would not have been so bad if laws protecting workers had been strengthened. Instead the laws have been weakened. The result has been low pay, longer working hours, a shameful workplace health and safety record, and work that is increasingly insecure. New Zealand has some of the weakest employment protections in the OECD, and National is promising to weaken them further. One major protection for workers, recognised in international law, is union membership (coupled with the right to bargain collectively), but this has been undermined by changes in the law and anti-union employers.
It doesn’t need to be like this. For example, Denmark is a country that has a similar agricultural background to New Zealand and a similar size population, but with much higher union membership (69 percent of workers in 2010, compared to 21 percent in New Zealand, according to the OECD). It also has lower inequality, much more generous unemployment benefits (for example, a one-earner, two-child family earning the average wage qualifies for assistance equivalent to 76 percent of their previous earnings in Denmark, compared to 59 percent here) and highly productive, high-value, high-wage industries.
Our employment laws and lack of support for high-value, high wage industries have instead created low wage, low-value work which is too often insecure.
Over 600,000 New Zealanders are unemployed or in ‘insecure’ work – jobs that are badly paid, can be terminated at any time or changed at a few hours’ notice, and make it impossible to plan a life outside work.
More generally, insecure work is any job that denies workers the stability they need for a good life and reduces their ability to control their own work situation, with damaging consequences for them, their families and their communities. It is work where the variable and changing nature of a job suits the employer but not the worker.
It is work where the burden of adjustment falls on the worker, and the inequality of power in the employment or contractual relationship disadvantages the person doing the work.
Unemployment jumped sharply in 2009 following the Global Financial Crisis, from 3.5% to over 6%. For the following five years under National it has remained stuck at 6%. No National Party administration in the past 25 years has got unemployment down below 6%, and there is nothing in the 2014 Budget to change that. Labour is targeting 4%.
Under-employment – workers seeking to increase their paid hours – also jumped in 2009 and shows no sign of falling under the current government.
New Zealand last year had the fifth highest GDP growth rate in the OECD but ended up 11th in terms of its unemployment rate (6 percent). In the first quarter of 2014 there were 154,000 unemployed, 254,000 jobless and 96,000 underemployed – a huge waste of human talent that makes a mockery of Government claims that work is easy to find for beneficiaries.
Even for those employed, many face insecurity in their jobs and miss out on employment rights. At least30% and possibly 50% of our workforce face uncertain hours of paid work, a real risk of losing their jobs, or other kinds of insecurity.
The so-called “flexibility” of labour laws since 1990 has encouraged intensive employment of low skilled insecure workers. Many productive industries paying good wages were destroyed in the “opening of the economy” without any strategy to replace them. Agriculture, finance and low-paying service industries dominate the economy but don’t create enough quality jobs to match the growth in the labour force.
In New Zealand workplaces there are currently 350-400 serious non-fatal injuries and 60-90 workplace deaths resulting from injury per year, plus 500-800 premature deaths per year from occupational illnesses. By international standards these are very high rates: too many workers are unsafe at work.
Pike River was only the tip of the iceberg of unsafe working conditions.
TAXES – THE PRICE WE PAY FOR A CIVILISED SOCIETY
It has been said that taxes are the price we pay for a civilised society. The price we all pay for National’s tax cuts and falling real government expenditure is greater inequality, poorer schools and hospitals, inadequate public transport, layoffs of public servants, slack regulation of unsafe workplaces, the selling-off of publicly-owned assets, and the creeping privatisation of roads and prisons.
The National Government’s 2014 Budget points to plans for yet more slashing of government services -
• not to confront any budget crisis
• not to repay debt,
• but to achieve their political aim of “smaller government” and to fund future promises of tax cuts with which National hopes to buy an election win.
The 2014 Budget claims2 that these unprecedented cuts will be made up for out of the so-called “projected Operating Allowance annual increment.” But there is not enough to make up all the cuts – not only Health and Education are being cut – let alone allow for new or improved services. In any case, that’s the money National has its eye on to fund tax cuts.
• The irony of this is that New Zealand is already one of the lowest-taxed countries in the developed world:
• Personal income tax rates on average are the third lowest in the OECD
• New Zealand charges less tax on high income earners than virtually any comparable country. Our 33% top tax rate is far below the OECD average of 42%, let alone Australia’s 49%. It is therefore one of the least effective at redistributing income to reduce inequalities.
• New Zealand is almost alone among developed countries in not taxing capital gains, and in levying no taxes on financial and capital transactions, nor on gifts and estates.
• Where New Zealand does get a big chunk of its revenue is from an unusually wide-ranging GST, which places the heaviest burdens on the least well-off.
NEOLIBERAL POLICIES IN THE 1980S AND 1990S
TRANSFORMED NEW ZEALAND INTO A MUCH LESS EQUAL
SOCIETY.
The current government’s policies preserve and reinforce that inequality
Unjustifiable income inequality means that many people miss out on their fair share of the income generated in the economy. The gains from economic growth over thirty years have gone mainly to the rich, with only modest gains for the bottom half of the income distribution, and actually falling real incomes for those at the bottom.
Between 1987 and 1994, neoliberal policies1 resulted in a sudden shift in income distribution which has remained locked-in for the following two decades. That step-change to a more unequal society is clear in the official statistics of inequality:
• The proportion of the population with income below 50% of the median (one measure of poverty) was 5% in 1986. By 1994 it was 13% and by 2011 it reached 15%.
• The share of the income generated in the economy that goes to wage and salary earners (the “Labour Share”) fell from 60% of income in 1981 to 46% in 2002 - in other words employees lost almost a quarter of their share of income. In 2012 New Zealand had the third lowest labour share among 32 countries in the OECD (greater only than Mexico and Chile).
• In 1982 the top 0.5% of income recipients received on average 8.6 times as much income as the bottom 90%. In 2011 the ratio was 14 times. In 1982 the average in the top 1% received 6.9 times the average of the bottom 90% of the population; by 2011 the ratio was 11 times.
Over the past decade income inequality has remained virtually unchanged. Bill English treats this as a success story. But there is, and will continue to be, steadily growing long-term damage so long as current inequality levels are tolerated, because of the effects on the distribution of wealth (assets like property, shares and bank deposits, less debt).
Wealth is distributed more unequally than income. In New Zealand, those in the top income decile receive close to 25% of gross income but those in the top wealth decile hold 50% of the total wealth.
The NBR Rich List (a significant part of the top 1%) had total wealth of $12 billion (in 2013 dollars) in 1986. By 2000 this had risen to $15.5 billion, and by 2012 to $60.4 billion. That explosion of wealth at the top developed after the big shift in income inequality, as rich people saved, speculated and invested out of their increased aftertax incomes.
Compared to a lot of other countries, New Zealand doesn’t spend much money on social services. We spend about 22% of GDP on things like health and education, roughly the OECD average – but far less than countries such as Denmark and Sweden, which spend over 30% (without any apparent effect on their economies, which have been stronger than ours for decades). And some countries like Australia look smaller because they offload some of their social spending from the government’s books by making private provision – like contributions to superannuation– compulsory, which could be seen as a tax by another name.
This lack of generosity can be seen in several areas. Especially for those who have just lost their job, New Zealand’s benefits are among the least generous in the world. The charts below show how much of their wage the benefits replaced for a two-earner couple with two children on two-thirds of the average wage and on the average wage, and a single person on the average wage with no children. In the first case, we’re bottom and in the other two cases we’re third to bottom when it comes to the generosity of our benefits. So it looks like we could do a lot more to support people who lose their jobs. It would help cushion the blow and give people some security while they look for work. More generous benefits allow people to find jobs that suit their skills and experience and are better paid rather than having to take the first that is available. They also recognise the fact that most involuntary job losses are due to closures and restructuring that is no fault of the workers and society should support them through the difficult change, just as it does if they get injured at work. Despite claims that high benefits encourage people to stay on welfare, people are in fact more likely to move quickly off benefits in countries where they are more generous.
RAISING THE ROOF Housing is becoming
harder and harder to afford for most New Zealanders
A key part of the Kiwi dream is being able to buy your own house – or, failing that, to rent somewhere that is warm and in good condition. But house buying is increasingly out of reach for many, as prices soar and incomes stagnate – while those renting or in state houses face equally severe problems.
Housing affordability
The average house used to cost about twice the average household net (disposable) income –which was a manageable amount for most people. Now, it costs five times the average household disposable income. Interest rates have, however, been lower in recent times, which reduces the overall costs associated with house buying.
But that’s little comfort to those who can’t even get on the housing ladder.
International evidence confirms that we’re doing badly: our house-price-to-average-income ratio is further aboveits normal point than in any developed country (except Belgium).It’s no wonder, then, that the number of families who own their home has fallen from 75% in the early 1990s to 65% now.
Housing costs – the wider problem
It’s not just house buying that’s the problem, because everyone, including renters, is having to spend more in housing costs – often too much.
The international standard is that no-one should have to spend more than 30% of their income on housing costs (otherwise there just isn’t enough left for other expenses). But the number of New Zealanders in that category has rocketed in the last few decades, from just 11% of the population to 27%. Those struggling the most are those on low incomes – over 40% of them have unmanageably high housing costs.
You might think that the transfer of key assets from public to private hands finished with the Government’s flogging-off of Genesis shares earlier this year. You would be wrong. National is planning a whole new raft of initiatives to enable private investors to profit at taxpayers’ expense.
• Charter school promoters are queuing up to collect tens of millions of taxpayer dollars diverted from the already-under-resourced public school system
• Private-Public Partnerships are still being considered for new hospital buildings
• Contracting-out of services formerly provided within the public sector is roaring ahead
This creeping “privatisation by stealth” is just as big a threat to the quality, integrity and cost of public services as the more open, barefaced looting of the public estate by private speculators, finance-sector operators and corporate opportunists during the great privatisation drives of 1988-1999 and 2010-2014.
The National Government’s determination to push ahead with selling off state-owned assets in the past three years has been driven by two things:
• pure ideology (a distaste for government enterprises in general, combined with a blinkered vision of the purposes for which they exist), and
• powerful vested interests in the financial and investment community with close ties to the National Party.
The vested-interest pressure comes from those who organise the sales (collecting fees and bonuses along the way) and from those who hope to turn a quick profit at the taxpayers’ expense by buying shares cheaply and then selling them off on a rising market. Neither of these groups has any interest in the public good. Both are motivated by private greed.
The Government’s argument that selling assets was a financially smart move to enable it to spend more on schools and hospitals does not hold up because the sales actually weakened the budget by about $145 million a year. That means fewer schools and hospitals, not more. (This figure is the Treasury’s forecast of the amount by which the asset sales will increase the annual budget deficit, or reduce the surplus, going forward, thereby reducing the ability of future governments to fund new services.)
The total cost of carrying out the sales was at least $140 million paid out in fees, commissions and payment for other services provided by private brokers, advertising agencies, and consultants of various sorts. In a nutshell, taxpayers paid out $140 million for the privilege of being made worse off to the tune of $145 million per year.
In principle, selling off public assets can be a way to raise funds to pay off government debt, or pay for spending that would otherwise have to be borrowed. But before going down that route, the real issue to be addressed is the public benefits that state ownership of the assets provides. Governments exist precisely to do what the profit driven private sector cannot and will not do; the neoliberal argument that government has no business running businesses simply ignores the real reasons for government participation in the market economy.
After twenty ideology-driven years of deregulation, a floating exchange rate, low-wage policies and union-busting, uncontrolled overseas borrowing and shrinking government, the New Zealand economy’s growth rate of income per capita remains stuck at or below 1% p.a.
The neoliberal legacy is increased economic reliance on agriculture, finance and low-paying service industries; a shrinking of manufacturing; an era of shameless price-gouging by unregulated or badly regulated monopolists and oligopolists in electricity, gas, and telecommunications; and the rise of huge personal fortunes gained by looting the public sector’s assets under the banner of privatisation. The Rogernomics-Ruthanasia period opened up a 30-40 percent wage advantage to Australia, which one or two years of growth rates – even a percentage point or so greater than Australia – will barely dent. New Zealand continues to fail to pay its way in the world economy, and the chronic current-account deficit translates to steadily increasing overseas debt.
This year’s temporary lift from the Christchurch rebuild, combined with high prices for milk powder and logs, may give the appearance of a brief boom, but New Zealand looks good only compared to the sick economies in Europe (where austerity policies are driving an entire continent toward recession and deflation) and the United States (where economic policy is paralysed by dogmatic partisan politics). It’s easy to look like a rock star when everyone else has laryngitis.
Authorised by Helen Kelly, NZCTU, Level 7, 178 Willis St, Wellington
ENDS
 Gordon Campbell: On The New Pope, And The Israeli Attack On Peter Davis
 New Zealand Labour Party: Labour Asks Why Govt Is Silent On Gaza
 Transport Accident Investigation Commission: Near-Collision Highlights Safety Lessons For All Busy, Unattended Aerodromes
 Green Party: Wildlife Law Change A Deep Betrayal Of Public Trust
 NZCTU: Unions Launch Petition To Protect Pay Equity
 Greenpeace: Greenpeace Slams PM’s Science Pick - 'Polluters Are Running The Show'
 NZ Government: PM’s Science Prizes Celebrate Excellence