 Scoop has an Ethical Paywall


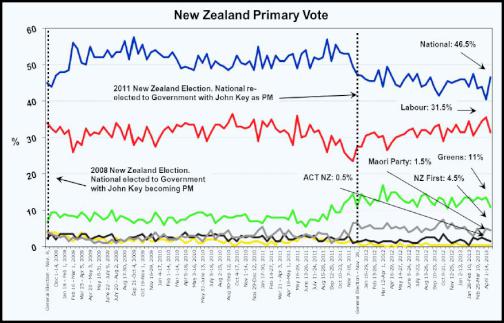
National Party rebounds 6% to 46.5%; Labour down 4% to 31.5%
[Full Article & Results at www.roymorgan.com]
National Party rebounds 6%
to 46.5%; Labour down 4% to 31.5%
As New Zealand passes
laws to legalise same-sex marriage
Finding
No. 4890 - This latest New Zealand Roy Morgan Poll on voting
intention was conducted by telephone with a NZ wide
cross-section of 877 electors from April 15-28, 2013. Of all
electors surveyed 5% (down 0.5%) didn’t name a party.: May
02, 2013
Today’s [2/5/13] New Zealand Roy
Morgan Poll shows a substantial gain in support for Prime
Minister John Key’s National Party to 46.5% (up 6% since
April 1-14, 2013). Support for Key’s Coalition partners
remains low with the Maori Party 1.5% (down 0.5%), ACT NZ
0.5% (unchanged) and United Future 0.5%
(unchanged).
Support for Labour is 31.5% (down 4%); Greens are 11% (down 2.5%), New Zealand First 4.5% (down 0.5%), Mana Party 1% (up 0.5%), Conservative Party of NZ 2% (up 0.5%) and Others 1% (up 0.5%).
Despite the strong rise in support for National, if a National Election were held now this New Zealand Roy Morgan Poll shows that it would be too close to call.
However, in further good news for the Government the latest NZ Roy Morgan Government Confidence Rating is up 4.5pts to 120.5 with 54.5% (up 3%) of New Zealanders saying New Zealand is ‘heading in the right direction’ compared to 34% (down 1.5%) that say NZ is ‘heading in the wrong direction’.
Gary Morgan says:
“Today’s New Zealand Roy Morgan Poll shows National (46.5%, up 6%) increasing its lead over the main Opposition Labour Party (31.5%, down 4%) after New Zealand became the thirteenth country in the world, and the first in the Asia-Pacific, to legalise same-sex marriage. Today’s result returns National to a lead similar to the lead it held two months ago in late February — National (47.5%) cf. Labour (30.5%).
“Although National has substantially increased their vote, the low support for governing Coalition partners the Maori Party, ACT NZ and United Future mean a combined Labour/ Greens/ New Zealand First coalition remains a good chance of forming Government after the next New Zealand Election — due late next year.”
Electors were asked: “If a New
Zealand Election were held today which party would receive
your party vote?”
This latest New Zealand Roy Morgan Poll on voting intention was conducted by telephone with a NZ wide cross-section of 877 electors from April 15-28, 2013. Of all electors surveyed 5% (down 0.5%) didn’t name a party.
VOTING INTENTION SUMMARY
The following table compares the latest NZ Morgan Polls on Voting Intention with the result from the November 26, 2011 General Election:
| PRIMARY VOTE | National | Labour | Green
Party | NZ First | Maori
Party* | Mana Party | ACT NZ | United
Future | Conservative Party | Other |
| % | % | % | % | % | % | % | % | % | % | |
| General Election, July 27, 2002 | 20.9 | 41.3 | 7 | 10.4 | n/a | n/a | 7.1 | 6.7 | n/a | 6.6 |
| General Election, September 17, 2005 | 39.1 | 41.1 | 5.3 | 5.72 | 2.12 | n/a | 1.51 | 2.67 | n/a | 2.48 |
| General Election, November 8, 2008 | 44.93 | 33.99 | 6.72 | 4.07 | 2.39 | n/a | 3.65 | 0.87 | n/a | 3.38 |
| General Election, November 26, 2011 | 47.31 | 27.48 | 11.06 | 6.59 | 1.43 | 1.08 | 1.07 | 0.60 | 2.65 | 0.73 |
| MORGAN POLL | ||||||||||
| […] January 2-13, 2013 | 46 | 31.5 | 12 | 5 | 2 | 0.5 | 0.5 | 0.5 | 1.5 | 0.5 |
| January 14-27, 2013 | 46 | 31.5 | 13.5 | 5.5 | 1.5 | 0.5 | 0.5 | ^ | 0.5 | 0.5 |
| January 28 - February 10, 2013 | 44 | 34.5 | 13.5 | 4 | 0.5 | 0.5 | 0.5 | ^ | 2 | 0.5 |
| February 11-24, 2013 | 47.5 | 30.5 | 12.5 | 3 | 2.5 | 0.5 | 0.5 | 0.5 | 2 | 0.5 |
| February 25 - March 10, 2013 | 43.5 | 32.5 | 13.5 | 5 | 2 | ^ | 0.5 | 0.5 | 2 | 0.5 |
| March 11-24, 2013 | 44 | 34.5 | 13 | 3 | 2.5 | 0.5 | 0.5 | 1 | 1 | ^ |
| April 1-14, 2013 | 40.5 | 35.5 | 13.5 | 5 | 2 | 0.5 | 0.5 | 0.5 | 1.5 | 0.5 |
| April 15-28, 2013 | 46.5 | 31.5 | 11 | 4.5 | 1.5 | 1 | 0.5 | 0.5 | 2 | 1 |
*The Maori Party was launched in July 2004; ^ Result less than 0.5%.
[Full Article & Results at
www.roymorgan.com]
Roy Morgan Research
New Zealand's leading social and market research company
A full service research organisation specialising in omnibus and syndicated data, Roy Morgan Research has over 70 years' experience in collecting objective, independent information on consumers. Roy Morgan Research was set up in New Zealand in the 1990s and has been collecting information across a wide range of industries in New Zealand ever since. Roy Morgan currently has over 10 years of trended data on a geographically and demographically representative sample of over 12,000 New Zealanders aged 14+.
 Gordon Campbell: On The Trump Upside, And Peters Persecution Of Trans People
 New Zealand Government: Accelerating The Roll-Out Of Public EV Chargers
 Save the City-to-Sea Bridge: Join on Sunday afternoon to save Wellington’s City-to-Sea Bridge
 New Zealand Defence Force: Second World War Veterans Receive Message From King Charles
 New Zealand Government: More Than 900 Health Graduates To Receive Financial Boost Through Bonding Scheme
 New Zealand Police: Stacks Of Cocaine Unpacked In Mt Wellington
 Te Pāti Māori: Te Pāti Māori Make Submission To Privileges Committee In Absentia