 Scoop has an Ethical Paywall


Roy Morgan Poll - National With Huge Lead Over Labour
Finding No. 4867
Available on
Website: www.roymorgan.com
On
February 28, 2013
See Roy Morgan Online
Store
roymorganonlinestore.com/Browse/New-Zealand.aspx
NATIONAL
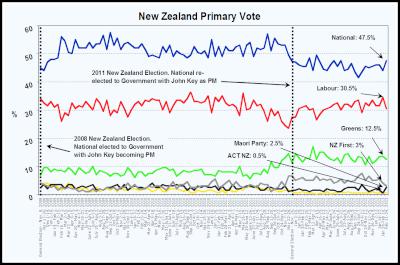
(47.5%) HAS HUGE LEAD OVER LABOUR (30.5%)
BIGGEST SINCE
JULY 2012 & WOULD WIN CLOSE
ELECTION
Today’s New Zealand Roy Morgan Poll shows a large gain in support for Prime Minister John Key’s National Party to 47.5% (up 3.5% since early February and the highest since July 9-22, 2012). Support for Key’s Coalition partners shows the Maori Party 2.5% (up 2%), ACT NZ 0.5% (unchanged) and United Future 0.5% (up 0.5%).
Support for Labour is 30.5% (down 4%); Greens are 12.5% (down 1%), New Zealand First 3% (down 1%), Mana Party 0.5% (unchanged), Conservative Party of NZ 2% (unchanged) and Others 0.5% (unchanged).
If a National Election were held today this New Zealand Roy Morgan Poll shows that the National Party with some minor Party support would win the Election.
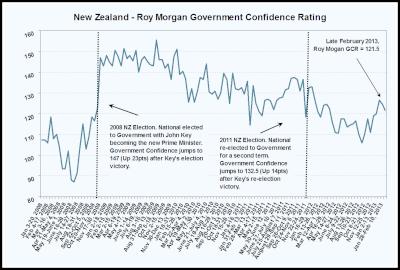
The latest New Zealand Roy Morgan Government Confidence Rating is down 3pts to 121.5 with 54% (down 1%) of New Zealanders saying New Zealand is ‘heading in the right direction’ compared to 32.5% (up 2%) that say New Zealand is ‘heading in the wrong direction’.
Gary Morgan says:
“Today’s New Zealand Roy Morgan Poll shows a surge in support for Prime Minister John Key’s National (47.5%, up 3.5%) now with its biggest lead over the main Opposition Labour Party (30.5%, down 4%) since July 2012. Support for third party the Greens has also dropped to 12.5% (down 1%).
“Today’s result was surveyed prior to Opposition Leader David Shearer’s cabinet reshuffle and suggests the changes were badly needed by an Opposition Party that is yet to make a serious dent in the strong lead held by Prime Minister Key’s National since the 2008 New Zealand Election, now over 4 years ago. Although the next NZ Election is still over 18 months ago, Labour must significantly improve its position if it is to have a real chance of regaining power in late 2014.”
Electors were asked: “If a New Zealand Election were held today which party would receive your party vote?”
This latest New Zealand Roy Morgan Poll on voting intention was conducted by telephone with a NZ wide cross-section of 1,052 electors from February 11 – 24, 2013. Of all electors surveyed 4% (up 0.5%) didn’t name a party.
Margin of
Error
The margin of error to be allowed for in any estimate depends mainly on the number of interviews on which it is based. The following table gives indications of the likely range within which estimates would be 95% likely to fall, expressed as the number of percentage points above or below the actual estimate. The figures are approximate and for general guidance only, and assume a simple random sample.
| Sample Size | Percentage Estimate | |||
| 40%-60% | 25% or 75% | 10% or 90% | 5% or 95% | |
| 500 | ±4.5 | ±3.9 | ±2.7 | ±1.9 |
| 1,000 | ±3.2 | ±2.7 | ±1.9 | ±1.4 |
| 1,500 | ±2.5 | ±2.2 | ±1.5 | ±1.1 |
Voting Intention Summary
The following table compares the latest New Zealand Roy Morgan Polls on Voting Intention with the result from the November 26, 2011 General Election:
| PRIMARY VOTE | National | Labour | Green Party | NZ First | Maori Party* | Mana Party* | ACT NZ | United Future | Conservatives | Other |
| % | % | % | % | % | % | % | % | % | % | |
| General Election, July 27, 2002 | 20.9 | 41.3 | 7 | 10.4 | n/a | n/a | 7.1 | 6.7 | n/a | 6.6 |
| General Election, September 17, 2005 | 39.1 | 41.1 | 5.3 | 5.72 | 2.12 | n/a | 1.51 | 2.67 | n/a | 2.48 |
| General Election, November 8, 2008 | 44.93 | 33.99 | 6.72 | 4.07 | 2.39 | n/a | 3.65 | 0.87 | n/a | 3.38 |
| General Election, November 26, 2011 | 47.31 | 27.48 | 11.06 | 6.59 | 1.43 | 1.08 | 1.07 | 0.60 | 2.65 | 0.73 |
| ROY MORGAN POLL | ||||||||||
| January 3-15, 2012 | 47 | 27.5 | 14.5 | 5 | 1.5 | 1 | 0.5 | 0.5 | n/a | 2.5 |
| January 16-29, 2012 | 46 | 30.5 | 13 | 5.5 | 2 | 0.5 | 0.5 | 0.5 | n/a | 1.5 |
| January 30 – February 12, 2012 | 45.5 | 31 | 11.5 | 6 | 1.5 | 1 | 1 | 0.5 | n/a | 2 |
| February 13-26, 2012 | 45.5 | 31.5 | 13 | 5 | 1.5 | 1 | 0.5 | 0.5 | n/a | 1.5 |
| February 27-March 11, 2012 | 48.5 | 30 | 12.5 | 5 | 1 | 0.5 | 0.5 | 0.5 | n/a | 1.5 |
| March 12-April 1, 2012 | 44 | 30.5 | 17 | 5 | 1.5 | 0.5 | 0.5 | 0.5 | n/a | 0.5 |
| April 2-15, 2012 | 49.5 | 26.5 | 12.5 | 6.5 | 1.5 | 1 | ^ | 1 | n/a | 1.5 |
| April 16-29, 2012 | 47 | 28.5 | 15 | 5 | 1.5 | 0.5 | 0.5 | 0.5 | n/a | 1.5 |
| April 30-May 13, 2012 | 44.5 | 30 | 15 | 5.5 | 1 | 0.5 | ^ | 1 | n/a | 2.5 |
| May 14-27, 2012 | 44 | 30.5 | 13.5 | 5 | 2 | 1 | 1 | 0.5 | n/a | 2.5 |
| May 28-June 7, 2012 | 46 | 31 | 12.5 | 5.5 | 1.5 | 1 | ^ | 0.5 | n/a | 2 |
| June 8-24, 2012 | 47.5 | 32 | 12 | 4 | 1.5 | 0.5 | 0.5 | 0.5 | n/a | 1.5 |
| June 25 – July 8, 2012 | 45.5 | 32.5 | 13 | 4.5 | 1 | 0.5 | 0.5 | 0.5 | n/a | 2 |
| July 9-22, 2012 | 47.5 | 30 | 11 | 5.5 | 1 | 0.5 | 1 | 0.5 | 3 | ^ |
| July 23-August 5, 2012 | 44 | 32 | 14 | 4 | 2 | 1 | 0.5 | 0.5 | 1.5 | 0.5 |
| August 13-26, 2012 | 44.5 | 32 | 14.5 | 5 | 2.5 | ^ | 1 | ^ | 0.5 | ^ |
| August 27-September 9, 2012 | 46.5 | 31 | 12.5 | 4.5 | 2.5 | 1 | 0.5 | ^ | 1 | 0.5 |
| September 10-23, 2012 | 43.5 | 33 | 11.5 | 5 | 2.5 | 1.5 | 0.5 | ^ | 2 | 0.5 |
| September 24 – October 7, 2012 | 41.5 | 33.5 | 13.5 | 6.5 | 1.5 | ^ | 0.5 | 0.5 | 2 | 0.5 |
| October 8-21, 2012 | 43.5 | 29 | 13 | 7.5 | 3.5 | 0.5 | 0.5 | ^ | 2 | 0.5 |
| October 29 – November 11, 2012 | 45.5 | 32.5 | 10.5 | 5 | 2 | 1 | 0.5 | 0.5 | 1.5 | 1 |
| November 12-25, 2012 | 45 | 31.5 | 13.5 | 6.5 | 1 | ^ | 0.5 | 0.5 | 1.5 | ^ |
| November 26 – December 9, 2012 | 45.5 | 33.5 | 11 | 5 | 1.5 | 1 | 1 | ^ | 1 | 0.5 |
| January 2-13, 2013 | 46 | 31.5 | 12 | 5 | 2 | 0.5 | 0.5 | 0.5 | 1.5 | 0.5 |
| January 14-17, 2013 | 46 | 31.5 | 13.5 | 5.5 | 1.5 | 0.5 | 0.5 | ^ | 0.5 | 0.5 |
| January 28 – February 10, 2013 | 44 | 34.5 | 13.5 | 4 | 0.5 | 0.5 | 0.5 | ^ | 2 | 0.5 |
| February 11-24, 2013 | 47.5 | 30.5 | 12.5 | 3 | 2.5 | 0.5 | 0.5 | 0.5 | 2 | 0.5 |
*The Maori Party was launched in July 2004; ^ Result less than 0.5%. The Mana Party was launched in July 2011.
Two-Party Preferred: National
Party led Government vs. Parliamentary Opposition
Parties
The following table compares the latest New Zealand Roy Morgan Polls on Voting Intention with the result from the November 26, 2011 General Election:
| National Party-led Government* | Parliamentary Opposition Parties# | |
| General Election, November 8, 2008 | 51.84 | 48.16 |
| General Election, November 26, 2011 | 50.41 | 46.21 |
| ROY MORGAN POLL | ||
| January 3-15, 2012 | 49.5 | 48 |
| January 16-29, 2012 | 49 | 49.5 |
| January 30 – February 12, 2012 | 48.5 | 49.5 |
| February 13-26, 2012 | 48 | 50.5 |
| February 27-March 11, 2012 | 50.5 | 48 |
| March 12-April 1, 2012 | 46.5 | 53 |
| April 2-15, 2012 | 52 | 46.5 |
| April 16-29, 2012 | 49.5 | 49 |
| April 30-May 13, 2012 | 46.5 | 51 |
| May 14-27, 2012 | 47.5 | 50 |
| May 28-June 7, 2012 | 48 | 51.5 |
| June 8-24, 2012 | 50 | 48.5 |
| June 25 – July 8, 2012 | 47.5 | 50.5 |
| July 9-22, 2012 | 50 | 47 |
| July 23-August 5, 2012 | 47 | 51 |
| August 13-26, 2012 | 48 | 51.5 |
| August 27-September 9, 2012 | 49.5 | 49 |
| September 10-23, 2012 | 46.5 | 51 |
| September 24 – October 7, 2012 | 44 | 53.5 |
| October 8-21, 2012 | 47.5 | 50 |
| October 29 – November 11, 2012 | 48.5 | 49 |
| November 12-25, 2012 | 47 | 51.5 |
| November 26-December 9, 2012 | 48 | 50.5 |
| January 2-13, 2013 | 49 | 49 |
| January 14-27, 2013 | 48 | 51 |
| January 28 – February 10, 2013 | 45 | 52.5 |
| February 11-24, 2013 | 51 | 46.5 |
*National-led Government: National Party, Maori Party, ACT NZ, United Future; #Opposition Parties: Labour Party, Green Party, NZ First, Mana Party. Conservative Party & Other not included as they are not represented in Parliament.
Finding No. 4867 is taken from Computer Report No. 2373
The Roy Morgan
Poll is conducted by the ONLY Australian and NZ member of
the Gallup International Association.
No other public
opinion poll taken in Australia or New Zealand has this
qualification.
NEW ZEALAND: HEADING IN
“RIGHT” OR “WRONG” DIRECTION?
Electors were asked: “Generally speaking, do you feel that things in New Zealand are heading in the right direction or would you say things are seriously heading in the wrong direction?”
| New Zealand Roy Morgan Government Confidence Rating: Interviewing Dates (National Party Government) | ||||||||||||
| Oct 24-Nov
6, 2011 | Nov 7-18, 2011 | Nov
22-24, 2011 | Jan 3-15, 2012 | Jan
16-29, 2012 | Jan 30-Feb 12, 2012 | Feb
13-26, 2012 | Feb 27-Mar 11, 2012 | Mar
12-Apr 1, 2012 | Apr 2-15, 2012 | Apr
16-29, 2012 | Apr 30-May
13, 2012 | |
| % | % | % | % | % | % | % | % | % | % | % | % | |
| Right direction | 58.5 | 60.5 | 49.5 | 60.5 | 61 | 57 | 53.5 | 52.5 | 53.5 | 55.5 | 55 | 51 |
| Wrong direction | 27.5 | 24 | 31 | 28 | 28 | 30 | 32.5 | 34 | 29.5 | 31 | 32.5 | 35.5 |
| Roy Morgan GCR# | 131 | 136.5 | 118.5 | 132.5 | 133 | 127 | 121 | 118.5 | 124 | 124.5 | 122.5 | 115.5 |
| Can’t say | 14 | 15.5 | 19.5 | 11.5 | 11 | 13 | 14 | 13.5 | 17 | 13.5 | 12.5 | 13.5 |
| TOTAL | 100 | 100 | 100 | 100 | 100 | 100 | 100 | 100 | 100 | 100 | 100 | 100 |
| New Zealand Roy Morgan Government Confidence Rating: Interviewing Dates (National Party Government) | ||||||||||||
| May
14-27, 2012 | May 28-June 7, 2012 | June
8-24, 2012 | June 25-July 8, 2012 | July
9-22, 2012 | Jul 23-Aug 5, 2012 | Aug
13-26, 2012 | Aug 27-Sep 9, 2012 | Sep
10-23, 2012 | Sep 24-Oct 7, 2012 | Oct
8-21, 2012 | Oct 29 – Nov
11, 2012 | |
| % | % | % | % | % | % | % | % | % | % | % | % | |
| Right direction | 49 | 48 | 52 | 51.5 | 50 | 49 | 49.5 | 51 | 47.5 | 44 | 49 | 51.5 |
| Wrong direction | 38 | 37.5 | 34.5 | 34 | 36.5 | 34.5 | 34.5 | 34.5 | 37.5 | 38 | 39 | 34 |
| Roy Morgan GCR# | 111 | 110.5 | 117.5 | 117.5 | 113.5 | 114.5 | 115 | 116.5 | 110 | 106 | 110 | 117.5 |
| Can’t say | 13 | 14.5 | 13.5 | 14.5 | 13.5 | 16.5 | 16 | 14.5 | 15 | 18 | 12 | 14.5 |
| TOTAL | 100 | 100 | 100 | 100 | 100 | 100 | 100 | 100 | 100 | 100 | 100 | 100 |
| New Zealand Roy Morgan Government Confidence Rating: Interviewing Dates (National Party Government) | ||||||||||||
| Nov
12-25, 2012 | Nov 26-Dec 9, 2012 | Jan
2-13, 2013 | Jan 14-17, 2013 | Jan 28 –
Feb 10, 2013 | Feb
11-24 2013 | |||||||
| % | % | % | % | % | % | |||||||
| Right direction | 48.5 | 53 | 53.5 | 57 | 55 | 54 | ||||||
| Wrong direction | 37.5 | 34 | 33.5 | 30.5 | 30.5 | 32.5 | ||||||
| Roy Morgan GCR# | 111 | 119 | 120 | 126.5 | 124.5 | 121.5 | ||||||
| Can’t say | 14 | 13 | 13 | 12.5 | 14.5 | 13.5 | ||||||
| TOTAL | 100 | 100 | 100 | 100 | 100 | 100 |
# Roy Morgan GCR = Roy Morgan Government Confidence Rating (The Roy Morgan GCR is 100 plus the difference between the percentage of New Zealanders who say the country is “heading in the right direction” and the percentage who say the country is “seriously heading in the wrong direction”).
Roy Morgan Research
New Zealand's leading social and market research company
A full service research organisation specialising in omnibus and syndicated data, Roy Morgan Research has over 70 years' experience in collecting objective, independent information on consumers. Roy Morgan Research was set up in New Zealand in the 1990s and has been collecting information across a wide range of industries in New Zealand ever since. Roy Morgan currently has over 10 years of trended data on a geographically and demographically representative sample of over 12,000 New Zealanders aged 14+.
 Gordon Campbell: On NZ’s Silence Over Gaza, And Creeping Health Privatisation
 PSA: Ministry Of Education Workers Will Walk Off The Job For The First Time In Over 20 Years
 Justice for Palestine: NZ Joining International Call For Humanitarian Aid To Gaza Welcomed, But Sanctions Need To Be Imposed On Israel Urgently
 Greenpeace: Leading Environmental Organisations Call On The PM To Reject The Regulatory Standards Bill
 Hon Matthew Robson: Former NZ Associate Minister Of Foreign Affairs Calls On NZ Government To Uphold International Law
 Save The Children: Budget 2025 Must Commit To Improving Children’s Well-Being
 Community Access Media Alliance: CAMA Urges Government To Recognise Community Access Media As Lifeline Utility In New Emergency Management Laws