Unemployment benefit numbers drop by 22% in 2005
Hon David Benson-Pope, MP
Minister for Social Development
and Employment
Member of Parliament for Dunedin
South
1 February 2005 Media Statement
Unemployment
benefit numbers drop by 22% in 2005
New statistics show that the number of people receiving an Unemployment Benefit fell by a further 14,543, or 22 percent over the year to December 2005.
Social Development and Employment Minister David Benson-Pope says the latest quarterly benefit statistics prepared by the Ministry for Social Development highlight the strong gains the Labour-led government has made in moving New Zealanders off benefits and into work.
The latest figures show that overall the total number of people receiving any kind of benefit decreased by a further 17,616, or six percent in the 12 months to December. Since December 1999 the total drop in the number of people receiving any kind of benefit has been 99,332 or 25 percent (from 401,415 to 302,083). This in turn has meant that there are 48,400 fewer children living in households dependent on benefits.
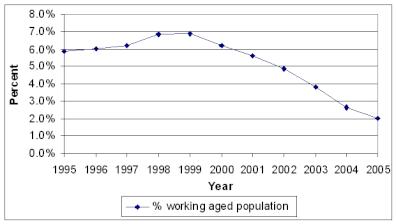
"Decreases in unemployment have been a key driver behind the overall drop in people receiving benefits," said Mr Benson-Pope. "Since 1999 we've seen 110,000 fewer people in receipt of unemployment benefits – dropping from 161,000 in 1999 to just over 51,000 in December 2005. That's a drop of nearly 70 percent.
Trends in proportion of the working aged
population receiving Unemployment Benefits at the end of
December, between 1995 and 2005.
"People need to keep in mind that the last Household Labour Force Survey showed unemployment falling to 3.4 percent, the lowest unemployment in the 19-year history of the survey and the lowest rate in the OECD. Many sectors still report a shortage of skilled workers and the Labour market is still generally characterised as being 'tight'.
"While undoubtedly we are entering a period of slower economic growth, this comes after a sustained period of exceptional growth. As a result we are strongly placed to manage our way through the forecast slowdown, before the rate of growth lifts again.
"The scenes of National Party politicians positively gloating at the prospect of ordinary hardworking New Zealanders losing jobs has been perverse, but their lack of even a basic understanding about this bigger employment situation has been just bizarre," said David Benson-Pope.
The latest statistics show that last year the number of people receiving the Domestic Purposes Benefit decreased by 3,037, or three percent. While the number of Sickness Benefit recipients increased by just 1,214, and the number of Invalid’s Benefit recipients increased by only 1,957 – a three percent rise for each respectively.
"We have seen a steep decline in the growth rate of Sickness and Invalid's Benefits. We are focused on new initiatives that help remove the barriers preventing those with ill-health or disability who want work, from finding it," said David Benson-Pope.
ENDS
Notes to Editors:
Trends in numbers of people receiving income support are more reliably shown by comparisons between the same quarter 12 months apart than by comparisons between consecutive quarters. Changes in benefit numbers between the end of September and the end of December are heavily impacted by seasonal influences including: patterns in the availability of seasonal work, the entry of graduating students into the labour market, and hiring patterns over the summer period. In addition, demand for Unemployment Benefits – Hardship – Students (UHS) peaks during December, and is also reflected in the December benefit statistics.
Working aged population receiving Unemployment Benefits at the end of December 1999 – 2005 by region
/ Dec 1999 / Dec 2004 / Dec 2005 / decrease 2004
-2005 / % change 2004-2005 / % change 1999-2005
Northland
/ 8,970 / 3,997 / 3,023 / 974 / - 24.4% / -
66.3%
Auckland / 40,931 / 17,653 / 14,252 / 3,401 / -
19.3% / - 65.2%
Waikato / 11,767 / 5,025 / 3,995 / 1,030
/ - 20.5% / - 66.0%
Taranaki / 10,387 / 4,921 / 3,881 /
1,040 / - 21.1% / - 62.6%
Bay of Plenty / 16,136 / 6,209
/ 4,467 / 1,742 / - 28.1% / - 72.3%
East Coast / 11,528 /
3,566 / 3,069 / 497 / - 13.9% / - 73.4%
Central / 9,775 /
4,111 / 3,030 / 1,081 / - 26.3% / - 69.0%
Wellington /
14,621 / 8,977 / 6,798 / 2,179 / - 24.3% / - 53.5%
Nelson
/ 7,157 / 1,876 / 1,440 / 436 / - 23.2% / -
79.9%
Canterbury / 15,916 / 4,441 / 3,278 / 1163 / -
26.2% / - 79.4%
Southern / 13,681 / 5,073 / 4,106 / 967 /
- 19.1% / - 70.0%
Other / 259 / 120 / 87 / 33 / -27.5% /
- 66.4%
Total / 161,128 / 65,969 / 51,426 / 14,543 / -
22.1% / -
68.1%


 Gordon Campbell: Gordon Campbell On The Folly Of Making Apologies In A Social Vacuum.
 Forest And Bird: Modernisation Of Conservation System Must Focus On Improving Conservation
 NZCTU: Uniformed Defence Force Should Not Be Used As Strike Breakers
 MetService: Damp Start To Canterbury Anniversary Weekend; Wet Start For Coldplay Fans In Auckland
 RNZ: Senior Lawyers Call For Treaty Principles Bill To Be Abandoned
 Lobby for Good: Small Business Owners, MPs Rally Together To Demand Transparency In Tauranga Marine Precinct Sale
 VisAble: National Apology Marks Important Step For Disabled Community, But True Change Requires Lasting Action


