Nature at risk: Damning report warns environment in serious trouble
Kate Gudsell, Environment Reporter
A bleak picture of the state of New Zealand's environment has been painted by the government's official report, Environment Aotearoa 2019.
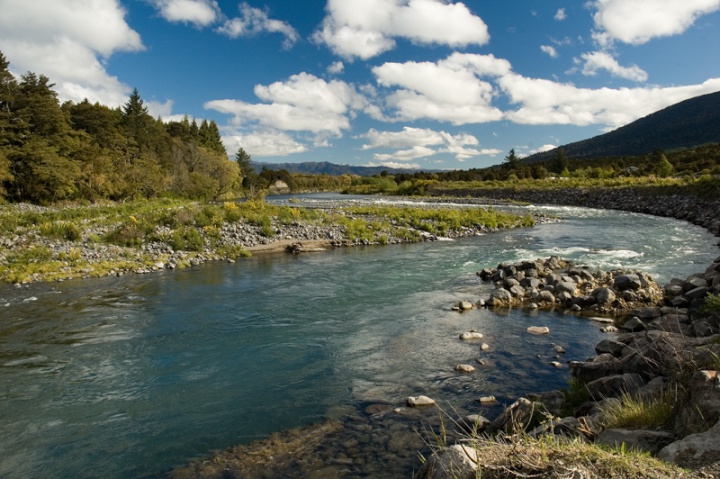
Tongariro River. (file photo) Photo: Nztayls / Wikipedia
The report is jointly produced by the Ministry for the Environment and Statistics New Zealand, and is a follow on from the last report in 2015.
• Scroll to the end to read the full report
The report says the way New Zealanders live and make a living is having a serious impact on the environment, and the benefits New Zealanders get from being in nature, though not measured or quantified, could be lost.
The report has outlined nine priority areas which are detailed below.
Biodiversity
 New Zealand is considered one of the most
invaded countries in the world.
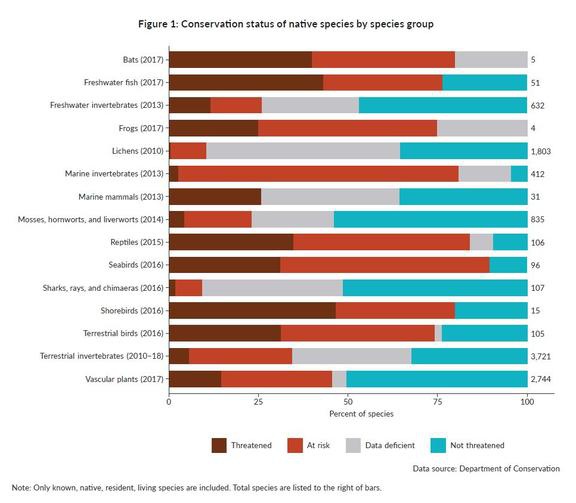
At least 75 animal and plant species have become extinct since humans arrived in New Zealand, and the extinction risk for 86 species has worsened in the last 15 years.
Species are at risk in marine, freshwater and land ecosystems. Cumulatively 4000 native species are currently threatened with or at risk of extinction - 90 percent of seabirds, 76 percent of freshwater fish, 84 percent of reptiles, and 46 percent of vascular plants.
Introduced plant species now out number natives in New Zealand, and similarly, stoats, possums and rats were present on more than 94 percent of land in 2014.
Added to that pressure is the threat of new diseases, such as myrtle rust, which arrived in 2017 and kills native plants like manuka, pohutukawa and rata.
The conservation status has improved for 26 species in the past 10 years, but more than half require active management to stay that way.
Land use
 What New Zealanders have
removed from the land, and what has been built on it has had
a detrimental effect on the environment.
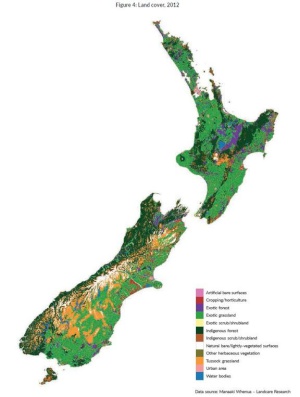
Native forests used to cover about 80 percent of the country, but now only cover just over a quarter of New Zealand.
Ten percent of the country was covered in wetlands, but 90 percent of these have now been drained.
In 2012, just over half of the country's land had been modified, like urban areas and pasture is now the single biggest type of land cover, making up about 40 percent of the total land area.
Between 1996 and 2012, more than 70,000 hectares of native vegetation were lost through conversion to pasture, plantation forestry and urban areas.
Urban growth
The growth of urban areas is threatening the supply of versatile land near Auckland and other regional centres.
Despite urban areas making up a tiny proportion of the country's total land area, just 0.85 percent or 228,000 hectares in 2012, most New Zealanders live in these areas, 86 percent according to 2018 population estimates.
Versatile land often has the best soils and has many agricultural uses, but between 1990 and 2008, 29 percent of new urban areas were on this type of land.
This means the land is gradually becoming unavailable for growing food, forcing growers onto more marginal, less productive land, which requires more fertiliser.
Water pollution in rural areas
New Zealand is an intensely farmed country, which has meant clearing native vegetation and draining wetlands, which in turn has dramatically affected soil and water function.
The national dairy herd increased by 70 percent between 1994 and 2017, while numbers of sheep and beef cattle declined. This shift is important because cows produce more nitrogen per animal than sheep, as they produce more urine, which has a higher nitrogen concentration.
The number of cattle per hectare has increased in some parts of the country, which in turn makes it more likely pollution will get into waterways.
The amount of nitrogen applied in fertiliser has also increased more than six-fold across the country since 1990.
Between 2013 and 2017, 71 percent of river length in pastoral farming areas had modelled nitrogen levels that could affect the growth of sensitive aquatic species.
During the same period, based on the predicted average Campylobacter infection risk, computer models estimated that 82 percent of the river length in pastoral farming areas was not suitable for recreational activities such as swimming.
Pollution in urban areas
Urban waterways face the same pollution problems as rural areas - excess nutrients such as nitrogen, sediment, and pathogens - but the levels are usually higher in cities and towns.
Urban waterways also contain other pollutants. These enter the water through the stormwater systems, which is rainwater plus any pollutants picked up on the surface such as nutrients, pathogens, sediment or heavy metals from road surfaces, tyres and brake pads.
Nutrients, pathogens and chemicals from businesses and households also enter water through the wastewater networks.
Where changes in water quality could be detected between 2008 and 2017, the majority of urban river water monitoring sites had improving trends for nutrients and sediment.
The trends for E coli were mixed, with some sites getting better and some getting worse.
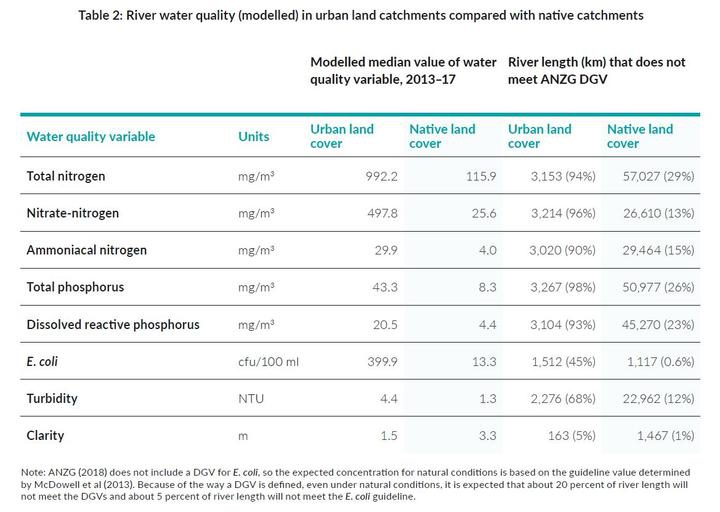
Between 2013 and 2017, based on the predicted average Campylobacter infection risk, computer models estimated 94 percent of the river length in urban areas is not suitable for activities such as swimming.
The models also show that 94 percent of river length in urban areas has nitrogen levels that may affect the growth of sensitive aquatic species.
Data is not available to assess the trends in light pollution, noise pollution, odours, or pollution in urban soil, land, or coastal waters.
Taking freshwater
Freshwater is used for hydroelectric generation, irrigation, domestic and industrial uses, which alters the water volumes and flows in rivers and aquifers.
In 2014, New Zealand had the second highest volume of water take per person of OECD countries.
Nationally, aside from water used for hydroelectricity (which does not consume water, but does alter river flows), irrigation holds the most resource consents to take water, 51 percent in the 2013/14 year.
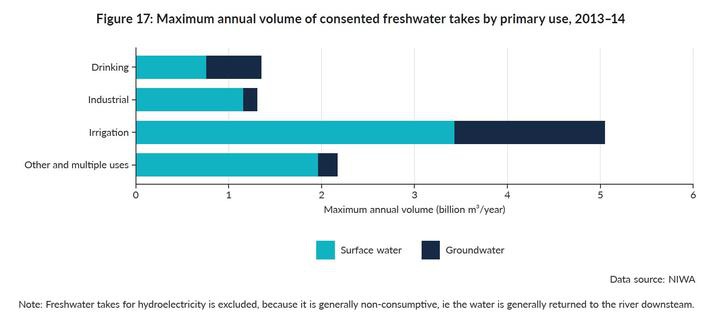
Household consumption made up 14 percent, and industrial use made up 13 percent.
The demand for fresh water for irrigation has increased markedly, driven by a near doubling of New Zealand's irrigated agricultural land area between
2002 and 2017, most notably in Canterbury.
Habitats for freshwater fish are reduced by low river flows, and this has consequences for the rest of the ecosystem, with the food chain being reduced.
Taking water can also reduce the flows and number of channels in braided rivers which affects threatened birds like wrybill and kaki.
Reduced and less variable flows also mean the temperature and concentration of nutrients and pathogens can increase and cause algal blooms, degrading ecosystems and making waterways unusable for recreation.
Marine fishing
 The whole
marine ecosystem is affected by fishing, fish stocks are
managed individually and do not take account of the
interaction between different stocks, or the broader marine
environment.
Because the cumulative effects of fishing is not known, it is unclear if the current levels of fishing are sustainable or where the tipping points are.
According to the report, commercial fishing has reduced in the last decade, and 97 percent of commercially-caught fish come from stocks that are considered to be managed sustainably.
However, the report also says in 2017, 16 percent of routinely assessed stocks were overfished and 10 stocks were considered collapsed.
Bycatch of protected species like Hector's and Mauid dolphins, fur seals, sea lions and seabirds has reduced according to the report, but the consequences are still serious as many of these species are already threatened.
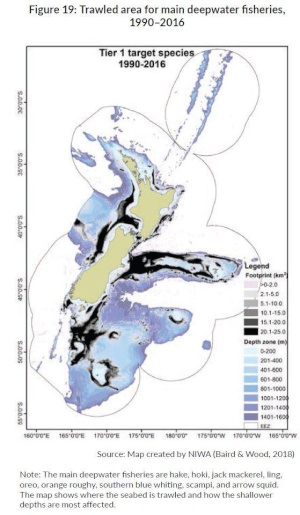
Seabed trawling for food like scallops and oysters is the most destructive fishing method. The area trawled and the number of tows have decreased over the past 15 to 20 years, but still cover a large area, between 1990 and 2016 trawling took place over approximately 28 percent of the seabed where the depth was less than 200 metres, and 40 percent where depth was 200 to 400 metres. Some areas have been trawled every year for the past 27 years.
The marine environment is also under pressure from excess sediment and nutrients from rivers, urban and plastic pollution, introduced predators, loss of habitats and a warming and acidifying ocean.
Greenhouse gas pollution
New Zealand makes a small contribution to global emissions, but has one of the highest per-person rate of greenhouse gas emissions for an industrialised country, most of which comes from livestock and road transport.
In 2015, New Zealand emitted 17.5 tonnes of carbon dioxide equivalent greenhouse gases per person, which was higher than all but five of the 43 industrialised countries signed up to the United Nations climate change convention, known as Annex I countries.
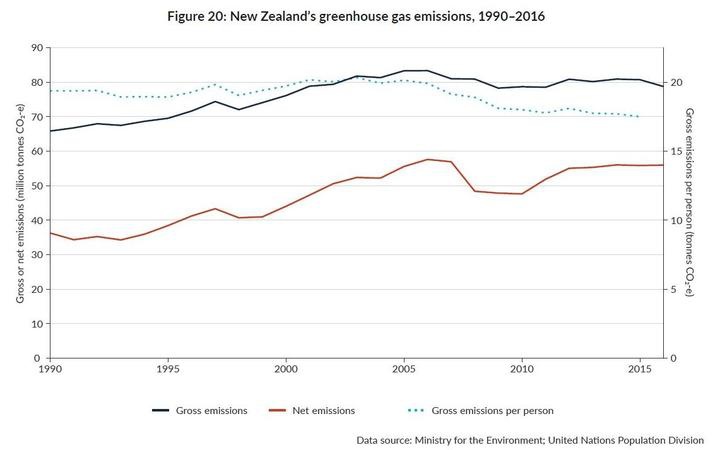
This is partly due to the large proportion of methane and nitrous oxide from agriculture, which have warm the atmosphere more strongly than carbon dioxide, and increase the per-person CO2-equivalent greenhouse gas emissions.
Road vehicles are the main source of CO2 emissions. New Zealand has the highest rate of car ownership in the OECD, and the cars are old compared to other countries.
New Zealand's larger cities tend to have high levels of black carbon (soot), one of the most important contributors to global warming.
Climate change
New Zealand is already experiencing higher land and sea temperatures, the sea rose 14 to 22 centimetres in the last century, the oceans are acidifying, there is more sunshine and the country's glaciers have lost a quarter of their ice in the past 40 years.
Some regions has drier soils, altered rainfall patterns, fewer frost days and more warm days, extreme wind has also increased in some places.
Studies suggest flood and drought events have worsened, and there is a higher likelihood of these happening.
Many of these impacts like erosion from extreme rainfall cannot be reversed.
These effects are expected to intensify in the coming decades and all aspects of life in New Zealand will be affected.
Read the full report:


 Ian Powell: Gisborne Hospital Senior Doctors Strike Highlights Important Health System Issues
 Keith Rankin: Who, Neither Politician Nor Monarch, Executed 100,000 Civilians In A Single Night?
 Eugene Doyle: Writing In The Time Of Genocide
 Gordon Campbell: On Wealth Taxes And Capital Flight
 Ian Powell: Why New Zealand Should Recognise Palestine
 Binoy Kampmark: Squabbling Siblings - India, Pakistan And Operation Sindoor