Simplifying our Tax and Benefit Systems - Part 2
Why are the Poor poor?
Part 2 in a series of articles from Simplifying our Tax and Benefit Systems. Full paper available at https://perce.harpham.nz
Part 1 - Simplifying our Tax and Benefit Systems is available here
The result of tax advantages given to companies are largely enjoyed by the better-off. Tax exemptions do not assist those with no income but increase inequality.
The step-wise structure of the current personal tax system gives more benefits to those who have more income. Those currently earning $70,000/yr or more would be in the same net position if all adults were given $9080 per year and all their income was charged at 33%. But those with no income or less than $70,000/yr would be better off. So why don’t we do this for adults 18 to 64?
And if we went further and paid adults $11,000/yr but still charged 33% on all their income we could abolish most benefits. We would then only need to get some $7billion/year of additional tax. Our tax and benefit systems would be greatly simplified.
Why are the Poor poor?
There are many reasons. Physical and mental sickness or disability aside there are strong inter-generational effects and, basically, the Poor are poor because they have no money and no assets. The world is then biased against them and their children. It is a vicious circle. It becomes impossible to borrow money, or only at penal rates of interest. When they are unable to meet their obligations they have their belongings repossessed and all credit denied to them. The better off may well have huge debts and be bankrupted but can be left with viable living arrangements and can start again. Or they may be sheltered by the use of trusts or company structures so that they go unscathed by leaving their debts behind. And they will probably know how to benefit from tax advantages enjoyed by companies and others.
Many of the poor are dependent on having jobs with wages. The lower their skill level the fewer choices they have and the more likely that they will only be able to get part-time jobs with significant unemploymnet.There are increasing prospects of their skills becoming redundant and they may not be able to afford to retrain or have the pre-reqisites for training.. Their Unemployment (now “Job Seeker”) Benefit requires them to seek work - this can be an expensive process. And so on.
The present taxation system exacerbates this. Companies pay 28% tax on profits. People pay up to 33% tax on income. The maintenance cost of a machine to replace a worker is tax deductible. The cost for a worker to stay alive is not deductible for their Income Tax purposes. It is tempting to think that the Living Wage could be made tax-free but this would require an enormous increase in other taxes and would not assist those with no income. And, again, with higher incomes one would get all the advantages intended to help those lower down while those with no income would get nothing.
If you are homeless you have great difficulty in registering for most things – benefits, bank accounts, credit cards and much else.
There are many ways in which those who are better off are advantaged by our current tax systems. GST at 15% hurts those who have to spend all their income on living much more than those who have disposable income and can afford to save. A recent example of built in bias to the better off is the choice of a levy on petrol instead of on rates. This is particularly unfair because in many cases new roads improve property values.
Huge complexities have been introduced over the decades to partially compensate for such issues. A well established axiom in developing computer systems is KISS - Keep It Simple Stupid. Our current tax and benefit systems are undeniably complex with undesirable side effects. Consider our system for Personal Income Tax. Some graphs may help to understand what is a fairly complicated situation.
Personal Income Tax
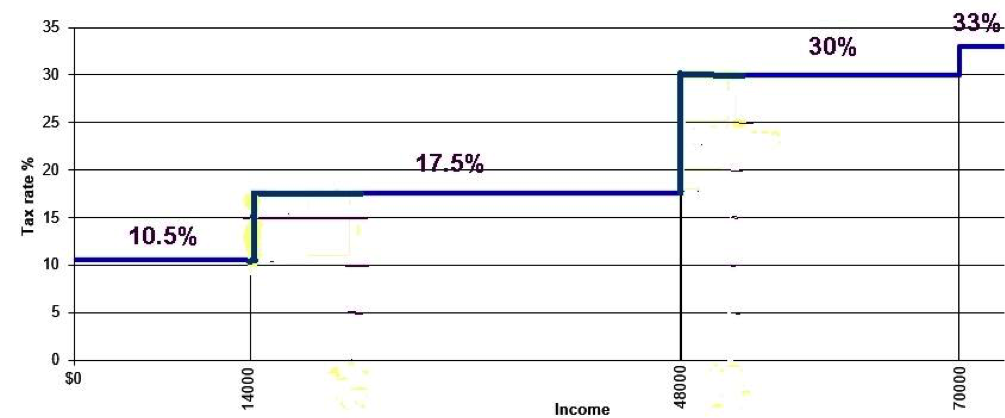
Figure 1.Tax Rate versus Income

On the left of the graph we have the percentage tax rate which applies for incomes as shown at the bottom. Thus one can see that below 14,000 per year of income the tax rate is 10.5%. Between 14,000 and 48,000 it is 17.5 %. Then another bracket with a rate of 30% and finally 33% applies regardless of how high the income may be.
At first sight it is good to have lower rates for lower incomes. They are effectively discounts from the top rate of 33%. But to get all the discounts available one has to have an income of $70,000/yr or above. The more income you have the more discounts you get. Up to $14,000/yr it is 22.5% (33%-10.5%) so on the full $14,000 this is 14000x22.5/100 = $3150/yr. In the next bracket it is 15.5% (33-17.5)%. On a full $48,000/yr this is(48000-14,000)x15.5/100 = $5,270/yr. But someone on 48,000/yr also gets the discount of $3150/yr on the first 14,000 of their earnings – a total of $8420. And someone on $70,000/yr or above scores a total discount of $9080/yr.
What is demonstrated here is that with this sort of structure the more you have the more you get. The Poor get relatively poorer. ALL the low tax benefits that are given to the less well off accrue to the better off also. Nonetheless when people moved up the income scale they complained for years about “bracket creep”. For example if they moved from 48,000 to 49,000 instead of rejoicing that they had more money they would complain that on the 12.5% higher tax rate they were paying $125 more tax than if they stayed on the on the old rate.
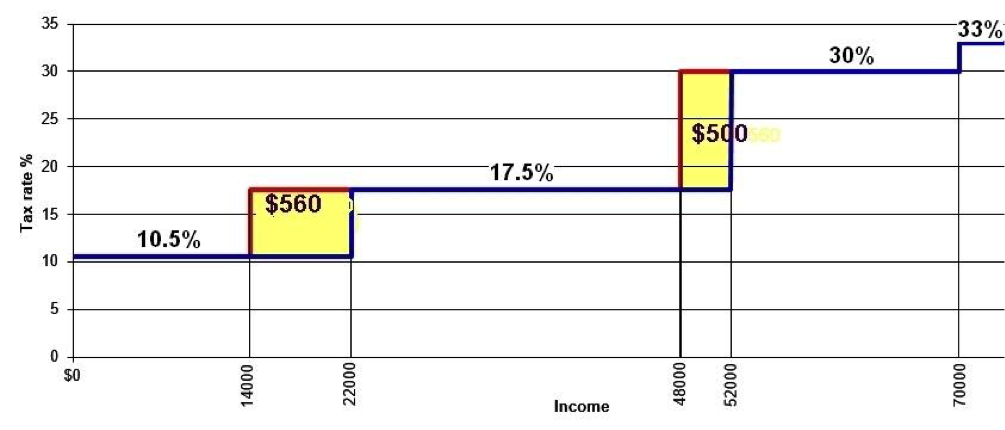
Figure2. Removing the “Bracket Creep”

Here we can see, in the block labelled $560, that the National Government moved the line for application of the 10.5% rate from 14,000 to 22,000. So in this $8000 range the rate decreased from 17.5% to 10.5%. A 7% discount. So those earning more than $22,000 would pay $560 less per year. Between !4,000 and 22,000 they would save a proportion of this.
Similarly the move from 48,000 to 52,000 shown in the block labelled $500 meant that those over 52,000 would save another 12.5% on $4,000.That is $500 per year added to the $560. And all those over $52,000 would get $1060 per year of tax cuts. But those with no income or below 14,000 per year would get none. Yet if the National Government had chosen to distribute about the same amount of money by making the first $5,000 of income tax free then everyone earning above $5,000/yr would have saved 10.5% of it - $525 per year. Or, possibly even better, reducing GST would have been of more benefit to those at the bottom.
Not surprisingly, the new Government moved the brackets back to where they had been and used the money to help with urgent problems.
Here we have another example of the general problem causing the Poor to be poor! Tax cuts do not benefit those with little or no income. The same is true for tax exemptions.
An example of the tax exemption effect is the exemption of “family homes” from the “bright line test”. This is of no benefit if you do not have a family home. And, worse, if the owner does not expect to meet the conditions for exemption the rent will no doubt increase as a result. And/or the availability of properties for rent may diminish.
Tax exemptions increase inequality!
Let us now speculate on what can be achieved by carrying the current Governments reversal of the tax cuts to a logical extreme.
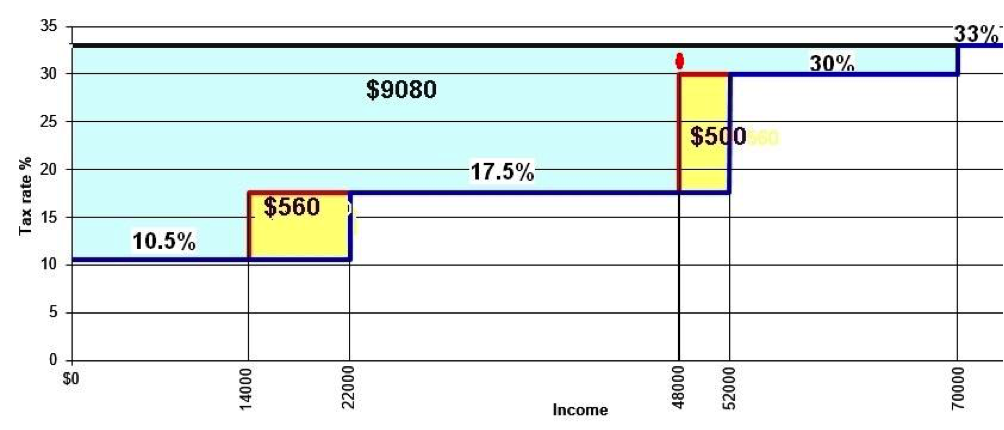
Figure 3. Making the Income Tax rate the same for everyone, or nearly everyone.

We have seen that the new Government moved the barriers back to their original positions so that those who earned more than $52,000 per year would not have a tax cut of $1060 per year and Government could fund other needs.
There is a need for Government to further increase its revenue. One possibility is to raise the top rate for incomes above, say, $150,000 in 1% increments every $50,000. It is now just 33% regardless of whether that income is in the multi millions or not. To avoid creating another “bracket” problem each increase could be levied on the WHOLE income so that those on higher rates do not get any advantage from lower rates on lower parts of the income. The highest tax rate might be capped at, say, 60%.
Whether the top rate is regarded as immutable or not then keeping the 33% rate above 70,000 but charging 33% from 48,000 instead of just 30% (see the short line extending the 48,000 line upwards) would collect $660 (3% on $22,000) from each taxpayer on 52,000 and above. Other similar moves are possible but let us think about the whole of the area above the current rate lines and make 33% the rate for all incomes. That would really deal with the bracket creep problem because there would be no brackets! All those on $70,000 upwards would then be paying an additional $9080 per year. And those below would also be paying more than at present. Horrors!
But we could pay all Adults $9080 per year and charge 33% on every dollar earned. Then those above 70,000 would be in exactly the same position as at present and those below would be better off . In fact those with no income would be $9080 per year better off. AHA! Those over 65 already have Superannuation and those below 18 have Working for Families. These are already in use and are currently funded. So, for the moment, we will only consider paying the $9080 as an Adult Basic Income to ages 18 to 64.
At $9080/yr this Basic Income would have some of the benefits noted above. But how would the country pay for those who are below the $70,000 limit and are better off with any such payment? The question looms even larger if we wish to replace all the bureaucracy and surveillance, leaving just that necessary to continue to provide hardship allowances. This replacement is needed if we are to become almost entirely free of stand-down periods, targeting, surveillance and poverty traps. The tax-free Basic Income would then simply depend on age. For this replacement we need to move the Adult Basic Income payment to a minimum of something like $11,000 per year. Then, using 2015/16 figures to get consistency across various data sets, we will need some 31 billion dollars. OUCH!
And while about $11,000/yr will let us remove most benefits without making the recipients worse off it will not improve things for them. The cost of hardship allowances could remain at about the current level unless it is decided to make them more generous Nonetheless let us work through the idea of having an Adult Basic Income of $11,000 per year and a 33% tax rate. The same process can then be followed to find the consequences of choosing some other figure.
Those above $70,000 per year on a tax rate of 33% levied on all of their income will then be paying an extra $9080/yr each while those below $70,000/yr will be paying proportionately less. But all this payment of the increased rate for those below $70,000/yr adds up to about $18bn. We might also save about 6bn from removing existing benefits and bureaucracy. (This needs careful detailed consideration with decisions to be made benefit by benefit).However we will need about 7bn more in tax if we have a tax-free Adult Basic Income of $11,000/yr and a universal tax rate of 33%.
Part 3 to follow is "The Choice of Tax?"


 Binoy Kampmark: Fallibility, Dirty Wars And Pope Francis I
 Peter Dunne: Dunne's Weekly - An Issue No-one Can Afford To Lose
 Martin LeFevre - Meditations: Choosing Mass Murder?
 Eugene Doyle: Quiet Mutiny - The U.S. Army Falls Apart
 Gordon Campbell: Papal Picks, And India As A Defence Ally
 Binoy Kampmark: The Selling Of America - Ending The US Dollar’s Exorbitant Privilege