Manjoo Critique in Salon is Superficial and Erroneous Nonsense
From...Ron Baiman's Actinomics
permalink with comments @ http://www.baiman.blogspot.com/
In his June 2, 2006 Salon article “Was the 2004 Election Stolen? No”, Farhad Manjoo claims to have “thoroughly debunked” a June 15, 2006 article in Rolling Stone by Robert F. Kennedy Jr.: “Was the 2004 Election Stolen?”.
As one of the (applied) statisticians cited in Kennedy’s article, I find that Manjoo’s “debunking” is either superficial spin that is easily refuted by adding more detail to Kennedy’s already very long piece, or simply factually erroneous. I will focus on the Manjoo points that relate to official return and exit poll data - my particular area of expertise.
1) Making the point that voters sometimes do vote more often for a “down ticket” candidate is hardly a “rebuttal” of the 12 County Ellen Connally “anomaly”. First of all this was not a normal election but rather one of the hardest fought Presidential races in recent history in a key battleground state. Moreover, Connally was an under-funded and largely unknown African American, liberal, pro-choice, pro-gay rights, anti-death penalty, woman from Cleveland, and all of these counties are far from Cleveland. But even if we disregard this, anybody who wishes to check the numbers posted on the Secretary of State of Ohio’s official website will find that:
a) nine out of only 14 counties (out of a total of 88 counties in Ohio) where Bush did abnormally well (over 43% better) relative to Moyer (the Republican Supreme Court nominee) just happen to be part of the same 12 counties where Kerry inexplicably did worse than Connally,
b) this was not a result of voters in these counties switching from Moyer to Connally as Connally’s vote is worse than the Ohio county average in all but one of these counties and Moyer’s vote is better than the county average in all but one of the 12,
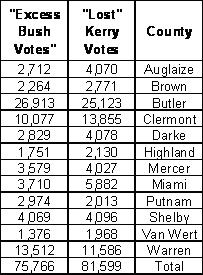
c) the “lost Kerry” vote of 81,599 (relative to the average Kerry/Connally ratio) just happens to be just about equal to the “excess Bush” vote of 75,766 (relative to the average Bush/Moyer average in the 12 counties), and
d) when one looks at the county by county pattern of “lost” Kerry votes to “excess” Bush votes, they match almost perfectly in their orders of magnitude – see the table below:

As Kennedy notes such an approximately 80,000 vote shift from Kerry to Bush would have given Bush an additional 160,000 votes, more than enough to steal an election which Bush won by about 119,000 votes. In other words, just this one “anomaly” is enough to support a “stolen election” hypothesis and I challenge anyone to come up with a plausible explanation of this set a)-d) of remarkable statistical “coincidences” as reflecting anything other than a pattern of vote shifting!
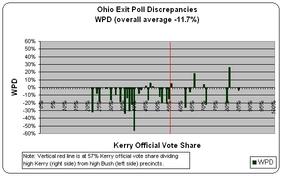
2) Manjoo’s claims that exit polls are not always accurate and that Mitfosky has an “explanation” for the large discrepancies (that he acknowledges were both highly significant statistically and the largest since 1988 in the January report) are both irrelevant when one considers the pattern of the exit poll discrepancy in Ohio – see graph below:

These are “within-precinct discrepancies” or ((Kerry -Bush Official Vote) minus (Kerry – Bush Exit Poll shares)) for each of the 49 precincts for which exit polls were taken in Ohio based on data released by the Election Science Institute in a report in which Mitofsky is listed as an “assisting author”. (Note that there are not 49 bars as some precincts have the same official Kerry vote share so that the bar is an average WPD.) Negative WPD reflects large Kerry exit poll “overstatements” relative to official vote counts. Note that almost all of the discrepancies are negative (against Kerry). In fact, as Kennedy reports, 20 of the 22 statistically significant discrepancies (large enough so that they could not plausibly be the result of random sampling error) are against Kerry. But even more striking is the pattern. On the right side in “high Kerry” precincts (above 57% official vote count – right of the red vertical line) there is a more or less random pattern of Bush (positive) and Kerry (negative) discrepancies, whereas on the left side (below 57% official Kerry vote – left of red line) almost all of the discrepancies (and all of the statistically significant discrepancies) go against Kerry. Moreover the precincts on the left are densely clustered whereas they are more dispersed on the right.
This strikingly non-uniform pattern cannot be explained by either large but “unbiased” (not one-sided) exit poll discrepancies – the pattern on the right, or by a “reluctant Bush voter response to the exit Poll” (“rBr” - Mitofsky’s hypothetical explanation) as this would not even produce the pattern on the left, not to mention the un-biased discrepancy on the right. Those who have been following the 2004 exit poll debate know that rBr would produce a “U” shaped pattern of discrepancies that are larger in more competitive precincts and taper off to nearly zero in highly partisan precincts. There is no such pattern on the left of the graph. But the pattern displayed is perfectly consistent with “vote shifting” from Kerry to Bush that would “move” precincts by their official vote count to the left thus producing large negative Kerry WPD and much smaller Bush WPD, and a clustering of precincts on the left. In fact Manjoo’s (or Lindeman’s) calculations of overall exit poll response averages are simply mathematically wrong, as they don’t take into account the larger proportion of Kerry or Bush voters in the “high Kerry” or “high Bush” precincts respectively – for accurate exit poll response rate estimates, and an explanation of why Mitofsky’s data contradicts his own “rBr” hypothetical see NEDA reports.
3) Manjoo’s claim that Mitofsky’s “rBr” hypothetical has not been decisively disproved is bunk. We applied an “optimal” (in the sense that this explained the WPD in more precincts than any other level of “rBr”) 59% to 50% excess Kerry to Bush voter completion rate to the Ohio data and found that 30% of Ohio’s exit polled precincts still had significant discrepancy, that these were still overwhelmingly against Kerry (11 out of 15) resulting in a 4.3% WPD against Kerry that was still more than double Bush’s 2.1% margin of victory in Ohio – see NEDA January report.
4) Finally, Manjoo’s claim that WPD’s in Ohio, Iowa, Nevada, and New Mexico were “not outside the margin of error” depends on how one calculates the “margin of error”. In particular, based upon a very liberal 30% “cluster factor” increase in the margin of error proposed (after the election) by Mitfosky, (and a doubling of the publicly posted sample size recently revealed by Mitofsky – see Baiman June 5, 2006 AAPOR presentation Free Press 6/5/06 posting) there was only about a 1 in 1,929 chance for the approximately 6.8% (weighted statewide) WPD in Ohio. This is well over any reasonable margin of error (typically set at about 1 in 20). Moreover, even using this very liberal margin of error, the odds of the Kerry exit poll discrepancies being as large as they were in the three key battle ground states of Ohio, Florida, and Pennsylvania simultaneously (and not just any random three states) is an impossible 1 in 133,000 (see Baiman Ohio Court Challenge affidavit).
In short Manjoo’s “debunking” of the official vote and exit poll analysis parts of he Kennedy article is superficial and erroneous nonsense. Moreover, we have been through this with Manjoo and many of the people that he cites before. He and they either do not understand the relevant statistics and mathematics of rigorous exit poll analysis and should not be reporting or prognosticating on this topic, or they simply refuse to accept their errors of interpretation and understanding.
ENDS


 Richard S. Ehrlich: Deadly Border Feud Between Thailand & Cambodia
 Gordon Campbell: On Free Speech And Anti-Semitism
 Ian Powell: The Disgrace Of The Hospice Care Funding Scandal
 Binoy Kampmark: Catching Israel Out - Gaza And The Madleen “Selfie” Protest
 Ramzy Baroud: Gaza's 'Humanitarian' Façade - A Deceptive Ploy Unravels
 Keith Rankin: Remembering New Zealand's Missing Tragedy