 Scoop has an Ethical Paywall


2004 Exit Poll "Red Shift" As Seen In Vote Numbers

Scoop Images: 2004 Exit Poll "Red Shift" As Seen In Vote Numbers
By Alastair Thompson with Ed Shalom
The following analysis was suggested to Scoop as a response to the Scoop article "Complete US Exit Poll Data Confirms Net Suspicions" concerning the discrepancies between the 2004 US exit polls and the Presidential election's actual results.
The exit polls showed Democrat John Kerry winning the election comfortably, but the actual election recorded Republican President George Bush winning by over 3 million votes.
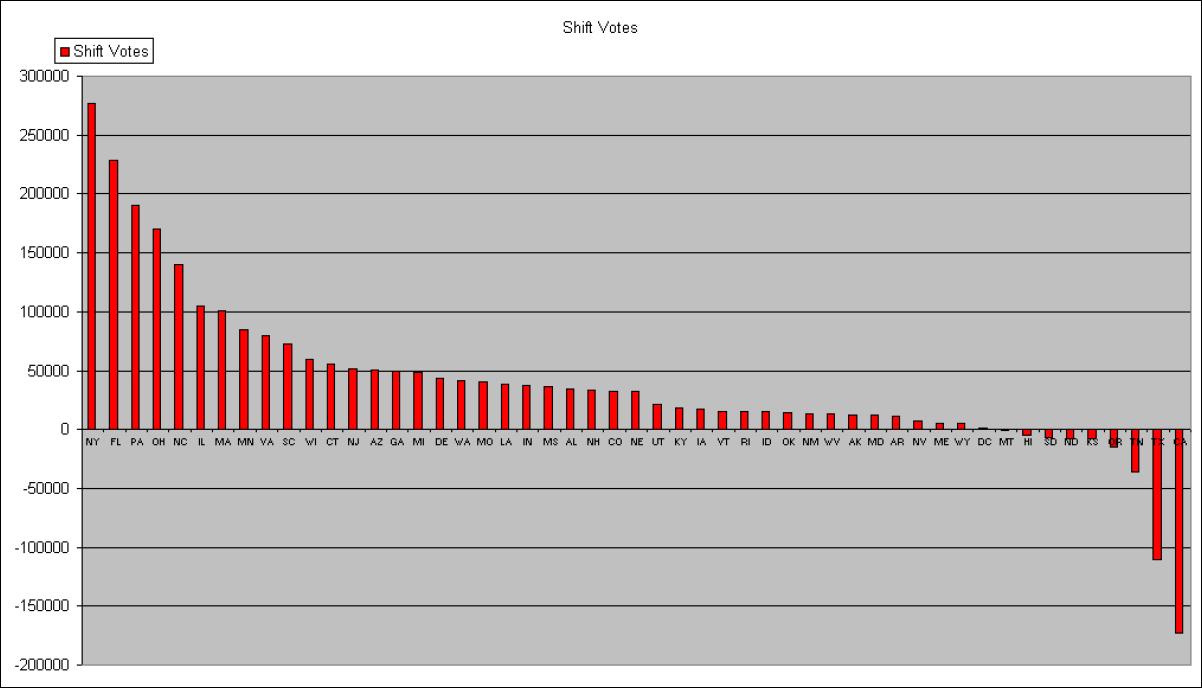
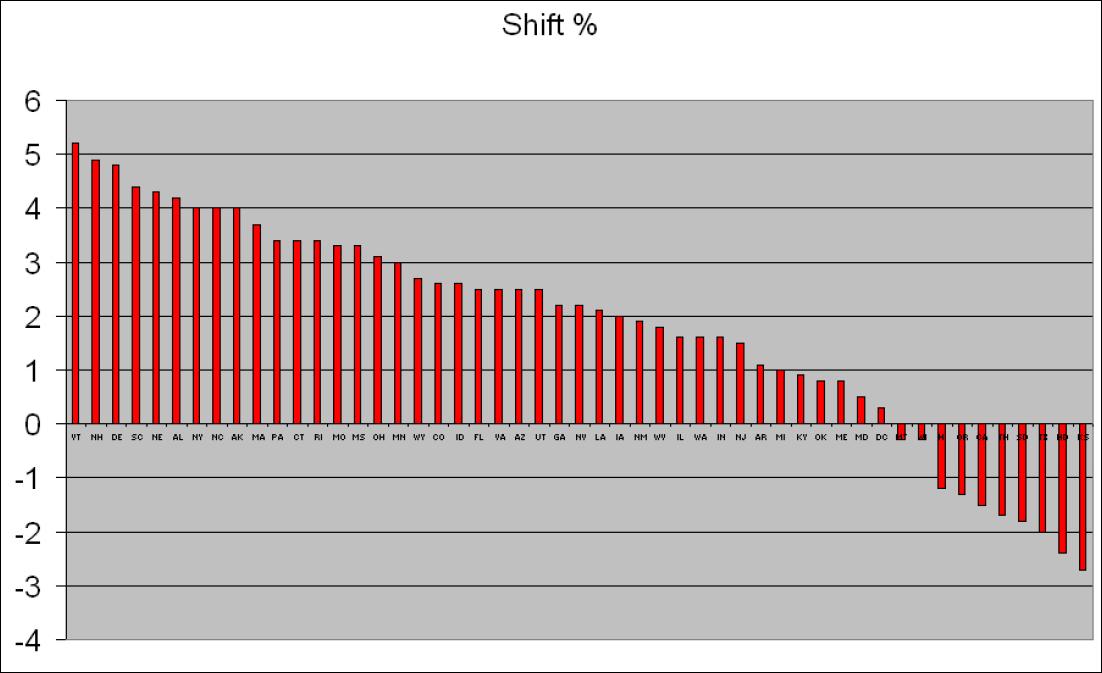
Democratic Underground forum member Ed Shalom suggested illustrating the observed State by State "Red Shift" (the difference between the US 2004 General Election exit polls - conducted by Edison Mitofsky - and the actual results) in terms of actual numbers of votes rather than simply as percentages.
As some US States have considerably more voters than others this image enables the reader to view where and how many votes were picked up by George Bush over and above what he was expected to receive in the 4pm and 12pm versions of the Edison-Mitofsky (National Election Pool) exit polls.
The numbers are obtained simply by multiplying total Presidential votes cast per state by the "red shift" percentage.
When presented in this way the data - both the 4pm data and the 12pm data used in the Freeman analysis(see below) - shows a remarkable conclusion, three of the four biggest vote "red shifts" occurred in the three battleground states of Florida, Pennsylvania, and Ohio. Notably the two giants in terms of Democratic Party vote bookend the series with New York showing the biggest gain in Bush vote numbers vs the exit polls and California showing the biggest vote loss.
Coincidentally Florida, Pennsylvania and Ohio were also the three states addressed in the academic paper "The Unexplained Exit Poll Discrepancy" by Dr Stephen F. Freeman. In this paper Dr Freeman discusses the use and methodology of exit polls extensively. He concludes that the odds of the level of variation from exit polls to actuals occurring in these three states as did so was 250 million to one. (note: Dr Freeman has agreed with critics of his report that this may overstate the case a little, but the odds of this occurring remain very very low and statistically speaking near impossibility.)
Dr Freeman ends his report saying:
"Systematic fraud or mistabulation is a premature conclusion, but the election's unexplained exit poll discrepancies make it an unavoidable hypothesis, one that is the responsibility of the media, academia, polling agencies, and the public to investigate."
To date no major US mainstream media outlet (with the sole exception of Keith Olbermann's Countdown show on MSNBC) has addressed the exit poll issue in spite of the fact that the data used in the exit polls was commissioned by them.

THE GRAPHS & DATA
Red Shift = (Bush Final Margin - Bush Exit Poll Margin)/2
Red Shift Votes = Red Shift * Presidential Votes Cast
4pm Data (via DUer TruthIsAll)

Click for big
version
The 4pm 2004 Exit Poll Bush "Red
Shift" In Percentage Terms
Click for big
version
The 4pm 2004 Exit Poll Bush "Red
Shift" In Terms Of Pure Vote
Numbers
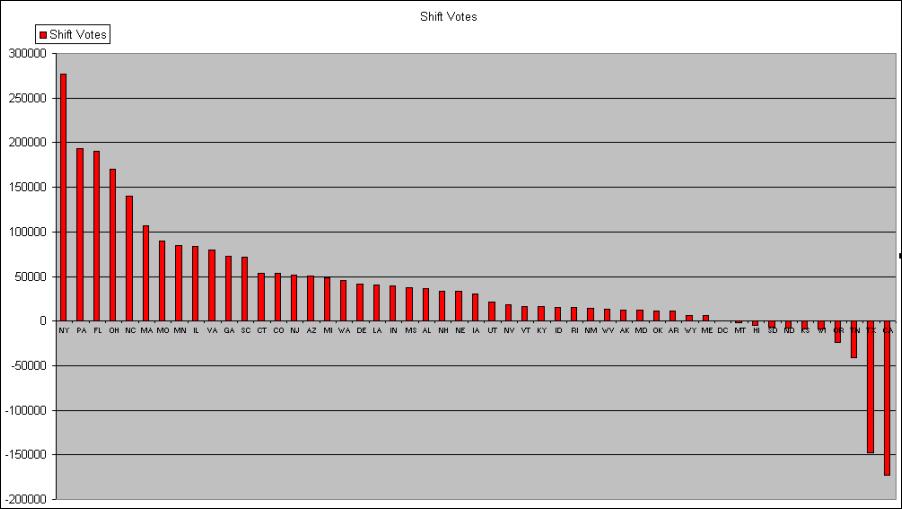
12pm Data (via Jonathan Simon)
Click for big version
The 12pm 2004 Exit Poll Bush "Red Shift" In Percentage Terms
Click for big version
The 12pm 2004 Exit Poll Bush "Red Shift" In Terms Of Pure Vote Numbers
NOTE THIS VERSION USES THE JONATHAN SIMON DATA 12pm Exit Poll Data rather than the 4pm data which is probably less accurate.
Figures for the "red shift" in the States of NY, NJ, NC and Virginia are estimated by halving the 4pm figures as the official 12pm data has not been publicly released.
|
State |
Total Vote |
Shift % |
State |
Shift Votes |
|
New York |
6,911,675 |
4 |
NY |
276467 |
|
Florida |
7,609,810 |
3 |
FL |
228294.3 |
|
Pennsylvania |
5,676,212 |
3.35 |
PA |
190153.102 |
|
Ohio |
5,481,804 |
3.1 |
OH |
169935.924 |
|
North Carolina |
3,500,998 |
4 |
NC |
140039.92 |
|
Illinois |
5,236,384 |
2 |
IL |
104727.68 |
|
Massachusetts |
2,888,068 |
3.5 |
MA |
101082.38 |
|
Minnesota |
2,828,387 |
3 |
MN |
84851.61 |
|
Virginia |
3,198,366 |
2.5 |
VA |
79959.15 |
|
South Carolina |
1,619,908 |
4.5 |
SC |
72895.86 |
|
Wisconsin |
2,992,390 |
2 |
WI |
59847.8 |
|
Connecticut |
1,578,385 |
3.5 |
CT |
55243.475 |
|
New Jersey |
3,437,013 |
1.5 |
NJ |
51555.195 |
|
Arizona |
2,013,080 |
2.5 |
AZ |
50327 |
|
Georgia |
3,298,790 |
1.5 |
GA |
49481.85 |
|
Michigan |
4,832,170 |
1 |
MI |
48321.7 |
|
Delaware |
861,739 |
5 |
DE |
43086.95 |
|
Washington |
2,852,876 |
1.45 |
WA |
41366.702 |
|
Missouri |
2,727,709 |
1.5 |
MO |
40915.635 |
|
Louisiana |
1,943,106 |
2 |
LA |
38862.12 |
|
Indiana |
2,468,002 |
1.5 |
IN |
37020.03 |
|
Mississippi |
1,125,304 |
3.25 |
MS |
36572.38 |
|
Alabama |
861,739 |
4 |
AL |
34469.56 |
|
New Hampshire |
677,662 |
4.9 |
NH |
33205.438 |
|
Colorado |
2,054,498 |
1.6 |
CO |
32871.968 |
|
Nebraska |
770,328 |
4.25 |
NE |
32738.94 |
|
Utah |
861,739 |
2.5 |
UT |
21543.475 |
|
Kentucky |
1,793,867 |
1 |
KY |
17938.67 |
|
Iowa |
1,496,214 |
1.15 |
IA |
17206.461 |
|
Vermont |
312,309 |
5 |
VT |
15615.45 |
|
Rhode Island |
437,126 |
3.5 |
RI |
15299.41 |
|
Idaho |
596,867 |
2.5 |
ID |
14921.675 |
|
Oklahoma |
1,463,758 |
1 |
OK |
14637.58 |
|
New Mexico |
756,040 |
1.8 |
NM |
13608.72 |
|
West Virginia |
746,309 |
1.75 |
WV |
13060.4075 |
|
Alaska |
309,379 |
4 |
AK |
12375.16 |
|
Maryland |
2,383,885 |
0.5 |
MD |
11919.425 |
|
Arkansas |
1,044,418 |
1.1 |
AR |
11488.598 |
|
Nevada |
829,583 |
0.85 |
NV |
7051.4555 |
|
Maine |
740,070 |
0.75 |
ME |
5550.525 |
|
Wyoming |
243,428 |
2 |
WY |
4868.56 |
|
D. C. |
205,854 |
0.5 |
DC |
1029.27 |
|
Montana |
449,666 |
-0.25 |
MT |
-1124.165 |
|
Hawaii |
429,013 |
-1.2 |
HI |
-5148.156 |
|
South Dakota |
388,215 |
-1.75 |
SD |
-6793.7625 |
|
North Dakota |
312,833 |
-2.5 |
ND |
-7820.825 |
|
Kansas |
312,833 |
-2.5 |
KS |
-7820.825 |
|
Oregon |
1,810,981 |
-0.8 |
OR |
-14487.848 |
|
Tennessee |
2,431,291 |
-1.5 |
TN |
-36469.365 |
|
Texas |
7,392,787 |
-1.5 |
TX |
-110891.805 |
|
California |
11,499,181 |
-1.5 |
CA |
-172487.715 |
Alastair Thompson
Scoop Publisher
Alastair Thompson is the co-founder of Scoop. He is of Scottish and Irish extraction and from Wellington, New Zealand. Alastair has 24 years experience in the media, at the Dominion, National Business Review, North & South magazine, Straight Furrow newspaper and online since 1997. He is the winner of several journalism awards for business and investigative work.
 Richard S. Ehrlich: Deadly Border Feud Between Thailand & Cambodia
 Gordon Campbell: On Free Speech And Anti-Semitism
 Ian Powell: The Disgrace Of The Hospice Care Funding Scandal
 Binoy Kampmark: Catching Israel Out - Gaza And The Madleen “Selfie” Protest
 Ramzy Baroud: Gaza's 'Humanitarian' Façade - A Deceptive Ploy Unravels
 Keith Rankin: Remembering New Zealand's Missing Tragedy