IN THIS EDITION: No US M3 Growth Since June 2004 - Is There A Vulnerability In The US Mortgage Market?
NOTE: Authors of this report will be anonymous and wide ranging, and occasionally finely balanced. Indeed you are invited to contribute: The format is as a reporters notebook. It will be published as and when material is available. C.D. Sludge can be contacted at sludge@scoop.co.nz. The Sludge Report is available as a free email service..Click HERE - http://www.scoop.co.nz/mason/myscoop/ to subscribe...
Sludge Report #165
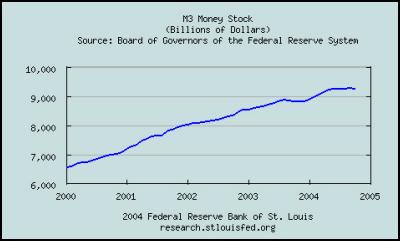
No US M3 Growth Since June 2004

Graph Source: http://research.stlouisfed.org/fred2/series/M3SL
There has been no growth in United States Money Supply for around five months.
In billions of US dollars the following are the weekly numbers for the M3 – the broadest measure of money supply – since the first week of June as reported by the Federal Reserve Bank of St Louis.
2004-06-07
9284.0
2004-06-14 9314.2
2004-06-21
9259.4
2004-06-28 9245.5
2004-07-05
9240.4
2004-07-12 9247.5
2004-07-19
9235.8
2004-07-26 9222.7
2004-08-02
9246.8
2004-08-09 9285.8
2004-08-16
9278.0
2004-08-23 9251.7
2004-08-30
9238.7
2004-09-06 9296.9
2004-09-13
9312.8
2004-09-20 9295.9
2004-09-27
9250.1
2004-10-04 9262.5
2004-10-11
9270.0
2004-10-18 9277.8
2004-10-25
9243.3
2004-11-01 9272.9
While the number has fluctuated up and down a little over the past few months. Today's number – for 1 November 2004 - is lower than that released on June 7th.
The M3 or money supply measures of the total amount of money (or debt) issued by US banks. Normally it would be expected to increase at a minimum of the annual rate of GDP growth, plus the annual inflation rate, plus the federal funds rate.
Assuming these are all roughly 2% PA (conservatively) then November's number ought to at a minimum 9469.68 US$billion .
Alternatively
if we look at increases in US M3 in the past we find:
-
between 1999 and 2001 US M3 increased by $500 billion each
year;
- and, between 2001 and 2003 US M3 increased at
$750 billion each year.
In calendar 2003 US M3 increased by $341 billion
So far in calendar 2004 US M3 has increased by $380 billion – but all of that in the first six month.
In theoretical terms the M3 is required to keep increasing in order that there is sufficient money in the system to pay both for new goods being produced as well as the interest on all debt already issued.
Exactly what the current situation means for the health and outlook for the United States economy is rather hard to fathom. It is certain however that historically speaking the present situation is highly unusual.
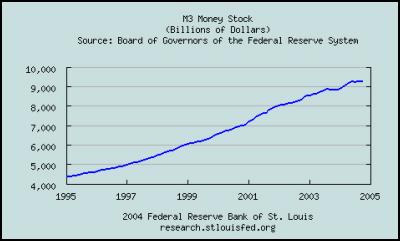
The graph that follows shows there is only one similar period in the past ten years when there has not been steady growth in the US M3 – a brief decline in US M3 in the latter half of 2003.

Graph Source: http://research.stlouisfed.org/fred2/series/M3SL/28/10yrs
At the time of the 2003 abberration there was some speculation about what it meant amongst pundits (including this column see... "Sludge Report #161 – A $64Bn Gorilla At The Fed") with "conventional wisdom" declaring that the effectwas as a result of traditional money supply – debt issued by banks – being converted into paper (bonds) issued by US corporates.
It was however generally accepted that if the decline continued it would eventually lead to a stagnation in the US economy and ultimately a recession.
The current period of no-growth in the M3 is longer than that from 2003. Yet this time around so far as the writer can ascertain via Google there is not yet any comment on the unusual circumstances on any of the main financial websites.
Is There A Vulnerability In The US Mortgage Market?
In some sectors of the financial community there has long been concern about perceived structural weaknesses in aspects of the US economy. In particular it is considered by the folk in the "Realty Reality Forum" at http://www.financialsense.com/ that the level of exposure of the US Economy to mortgage debt issued by the GSE's is far to high.
The GSE's are the giant US Government owned and operated mortgage security companies, Fannie Mae, Freddie Mac and Ginnie Mae.
Today there was some news on this front that relates indirectly to the M3 observations above. After the close of the market on Monday (earlier today NZ Time) Fannie Mae issued a statement saying it is looking at a $9 billion loss in its derivatives portfolio if regulators don't accept its accounting practices.
According to TheStreet.com:
" Fannie said its auditor needs more time to go over its finances, in light of the serious questions raised about the firm's accounting practices by its regulator. The Washington-based company offered no timetable for completing the review, other than to say it won't be done this week.… snip…
In September, OFEHO told Fannie to increase its surplus capital to 30% above the regulatory minimum, after the regulator found serious flaws with Fannie's accounting practices as well as evidence of earnings management. The regulatory minimum represents the amount of cash needed to guard against the risk of a big loss on an investment or in the value of the company's enormous mortgage portfolio.
As of June 30, Fannie reported $36.1 billion in capital. That's roughly $4.9 billion, or 16%, above the current required minimum capital level of $31.2 billion. Using those numbers, Fannie would need to raise just $4.46 billion to get to its new target, the 30%-plus threshold of $40.1 billion.
But if Fannie incurs a $9 billion shortfall, it would need to raise a little more than $13 billion to meet the regulators' standard. "
Sludge cannot help thinking that if Fannie Mae needs $13 billion of new capital urgently and the M3 is declining, she may just find it a bit hard to find.


 Keith Rankin: Zero-Sum Fiscal Narratives
 Eugene Doyle: Chinese Jet Shoots Down France’s Best Fighter; NZ And Australia Should Pay Attention
 Ian Powell: “I Can Confirm They Are Hypotheticals Drawn Largely From Anecdotes And Issues The Minister Has Heard About.”
 Gordon Campbell: On NZ’s Silence Over Gaza, And Creeping Health Privatisation
 Richard S. Ehrlich: Pakistan & China Down 6 Indian Warplanes
 Keith Rankin: War In Sudan