 Scoop has an Ethical Paywall


A Covid Graph That Reveals So Much

The Australian Department of Health, States and Territories regularly reports on a range of Covid-19 data such as daily infections and deaths. These reports also include hospitalisations (both in wards and in intensive care units).
The data as of 4 December for hospitalisations in the states and territories is revealing for comparing the effectiveness of the conflicting elimination (zero tolerance) and suppression (mitigation) strategies for responding to community transmission of Covid-19’s delta variant.
The data is directly relevant to the New Zealand government’s 4 October u-turn in Auckland from elimination to suppression (the rest of the country remained in elimination until the recent introduction of the vaccine pass and ‘traffic lights system’).
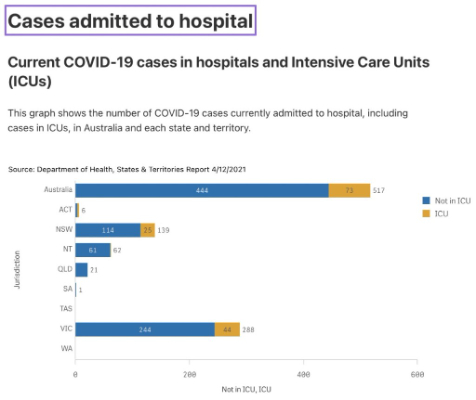
This is highlighted in the Department’s graph below:
Tale of two ‘Australias’
The divide between two different ‘Australias’ in the delta response needs to be understood. The two most populated states (New South Wales and Victoria) cover around 58% of the country’s population; they followed suppression.
The remaining four states (Queensland, Western Australia, South Australia and Tasmania) and two territories (Northern and Australian Capital) cover 42% of the population and followed elimination.
When delta first arrived the response of New South Wales was to dither and delay before adopting an uneven mitigation strategy. The effect was to exponentially spread the virus so that it became out-of-control leading to a massive increase in avoidable infections, hospitalisations and deaths.
Victoria initially adopted elimination with a hard lockdown. For a while results were encouraging. But it ran into two main difficulties. First, the state shared a large difficult to monitor border with New South Wales which meant much virus spread from its northern neighbour.
Second, there was already a high level of lockdown fatigue in Victoria. Earlier it had to go into a second severe lockdown, unlike the other states, largely due to poor quarantine and isolation facility security (including untrained) which had been wisely contracted out to the private sector which used sub-contractors.
Although that second Victorian lockdown succeeded in eliminating community transmission it was tough. Delta’s arrival was a recipe for public protest against the state’s third lockdown which became a further virus spreader. Consequently Victoria had to abandon elimination and shift to suppression.
The remainder of Australia continued with their forms of elimination when delta arrived beginning with speedy lockdowns (Tasmania succeeded in keeping delta out completely so border controls were sufficient without lockdowns).
Although harder these ‘remainder’ lockdowns were also much shorter than New South Wales and Victoria. Subsequent delta cases were few and far between; and able to be dealt with by short, limited restrictions (ACT was compromised being surrounded by New South Wales).
What the graph reveals
The graph confirms the comparative effectiveness of the two delta response strategies. Looking first at hospitalisations (excluding the more critically ill in intensive care units) 81% were in the suppression/mitigation states (58% of Australia’s population).
This left 19% of these hospitalised in wards in the elimination states and territories (42% of population). There were none in Western Australia and Tasmania. The majority of non-ICU hospitalisations were in the small populated Northern Territory.
Then, looking at the critically ill hospitalised in intensive care units, over 94% were in the suppression/mitigation states with the rest in the elimination states and territories. What’s more, there were no intensive care Covid patients in any of the four elimination states; in fact all were in the New South Wales surrounded Australian Capital Territory.
What about New Zealand
When the delta variant first came to New Zealand in August the Government’s response was to continue with its successful zero tolerance elimination strategy beginning with a national Level 4 lockdown (the hardest of the four elimination alert levels).
As with the remainder of Australia, it proved effective allowing the country outside Auckland to drop first to Level 3 (loosened lockdown) and then to Level 2 (public health measures).
A key justification of the Government was the importance of avoiding what New South Wales in particular was experiencing and instead to follow the successful experience of the remainder of Australia.
Prime Minister Jacinda Ardern was explicit in her public comments at the time – New Zealand should not follow New South Wales; instead it should take comfort from the successful elimination states in Australia.
The results of the Level 4 lockdown were impressive. Outside Auckland was able to lower its alert level first to 3 and then leave lockdown for Level 2. In Auckland, after an initial increase, daily infections declined steadily and actually reached single digit levels.
Oops
Then, through a mix of political overconfidence, wrong Ministry of Health advice and vociferous pressure from short-sighted business interests, the Government ignored its modelling advice and prematurely lowered Auckland’s alert level to 3. The inevitable result was a reversal of the declining rate of infections and instead an exponentially increasing delta spread.
This rocked the Government who panicked leading it to abandon elimination in Auckland for the suppression/mitigation approach of New South Wales. It led to replacing alert levels with traffic lights (essentially morphing four alert levels into three but giving them colours for branding purposes).
Vaccine passes are not dependent on traffic lights despite the way they are intertwined by the Government. They could have just as readily (if not more so) operated under alert levels. Meanwhile the Government began to refer to New South Wales in a more favourable tone.
Rating New Zealand’s delta response
Owing to the fact that New Zealand began its delta response speedily with elimination and continued it for the rest of Aotearoa after its Auckland u-turn on 4 October, the country was able to avoid the full severity experienced by New South Wales and Victoria.
Nevertheless this most likely meant more infections and hospitalisations (possibly deaths) than would otherwise have been the case. It also most likely meant a much longer lockdown than would otherwise have been the case.
If you had to simplify the description of the effectiveness of New Zealand’s response to the Covid-19 delta variant, it would be somewhere between the elimination and mitigation Australian states but arguably closer to the latter than the former.
But for the premature decision to lower alert levels in Auckland and the decision-making panic that followed, it would have been either the other way around or the same as Australia’s elimination states.
Ian Powell
Otaihanga Second Opinion is a regular health systems blog in New Zealand.
Ian Powell is the editor of the health systems blog 'Otaihanga Second Opinion.' He is also a columnist for New Zealand Doctor, occasional columnist for the Sunday Star Times, and contributor to the Victoria University hosted Democracy Project. For over 30 years , until December 2019, he was the Executive Director of Association of Salaried Medical Specialists, the union representing senior doctors and dentists in New Zealand.
 University of Auckland: Billion-dollar Business Lessons From Kiwi Entrepreneur
 NZ Veterinary Association: NZVA Celebrates Welcome Additional Support From Veterinary Nurses
 Michael King Writers Centre: New Zealand’s National Writer-Residency Organisation Announces Its 2025 International Residency With Australia
 Endometriosis NZ: Desogestrel Funding A Major Boost For Endometriosis Patients
 Auckland Festival of Photography: Project Launched To Capture And Diversify Auckland’s Visual Heritage
 PHARMAC: New Insulin Medicine Proposed For People With Diabetes