Health Insurance Numbers Down 0.5 Percent
May 24, 2013
MEDIA RELEASE – FOR IMMEDIATE
USE
Health Insurance Numbers Down 0.5 Percent
The first three months of 2013 saw a reduction of half a percent in the number of New Zealanders with health insurance cover, according to figures released today by the Health Funds Association.
HFANZ chief executive Roger Styles said this was in line with the previous two March quarters where the organisation had recorded a drop in the number of lives covered. Given the economic backdrop, this was expected.
Mr Styles pointed to ongoing uncertainty about how long exactly the wait was in the public system - to see a specialist and then have a procedure performed - as a key reason people were retaining health insurance.
“A good example of the public uncertainty is ACC declining more and more surgery claims, particularly for the elderly. This has forced thousands of people to turn to their health insurer to fund treatment, and many thousands more to join public hospital waiting lists.
“An even bigger issue going forward will
be the flow-on effects from the reduction in public
spending. The Government’s 2.2 percent increase in
operating spending on health in last week’s budget was
among the lowest in recent years, and there are signs that
this may be the new normal,” he said.
“The Treasury
will later this year set out some detailed policy options to
further curtail public health spending growth. Some of these
have already been flagged, including increased rationing in
the public sector and greater use of patient
co-payments.
“Though the future shape of public health cuts – or savings – is not yet known, a lot of people understand that increasingly they are going to have to pay for more and more of their healthcare costs. Health insurance will play a big part of this,” Mr Styles said.
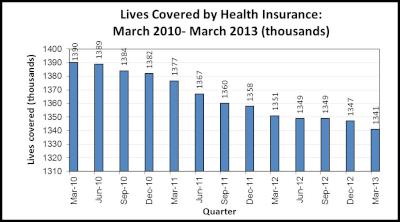
Lives covered as at March 31 were 1.341 million – just on 30 percent of New Zealanders. This is expected to fall to just below 30 percent later in 2013.
Claims paid for the March 2013 quarter totalled $199 million, bringing the annual paid for the 12 months to March 31 to $880 million, up 4.2 percent on the March 2012 year.
Premium income for the March 2013 year was up 4.6 percent on the previous March year to a total of $1.102 billion.
Quarterly statistical summary: March 2013
This statistical supplement sets out key health insurance statistics for lives covered, claims and premiums over the previous quarter and 12 month period, together with commentary on changes and underlying trends.
Headline changes
• Lives
covered down 6500 or 0.49 percent for the quarter; reduction
of 0.75 percent for the year;
• Premium income of $280
million for quarter, up 1.3 percent on December quarter;
annual premium $1.102 billion, up 4.6 percent on March 2012
year;
• Claims paid for quarter of
$199 million, annual claims paid for March year of $879.6
million, up 4.1 percent on March 2012 year
claims.
Lives
covered
Total lives covered as at 31
March 2013 stood at 1,341 million. This is a decrease of
6500, or 0.49 percent, over the March quarter and represents
a reasonably significant decline following several quarters
where lives covered were showing signs of stabilising. On an
annual basis, lives covered declined by 10,100, or 0.75
percent.
Click for big version.
The March quarter traditionally shows flat or negative movement in lives covered, as lapses take effect while new lives covered are lower in the New Year. It is noted that the decline in the March 2013 quarter is of similar proportion to that in the previous two March quarters.
Trends by
age-group
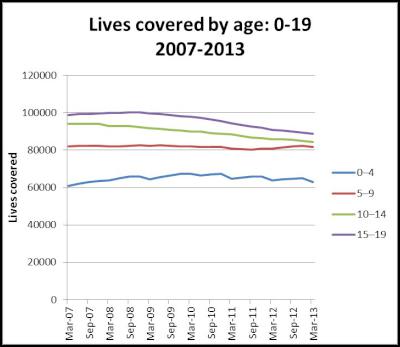
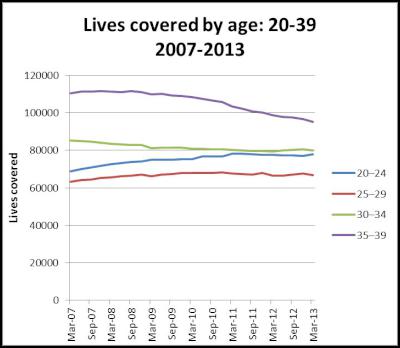
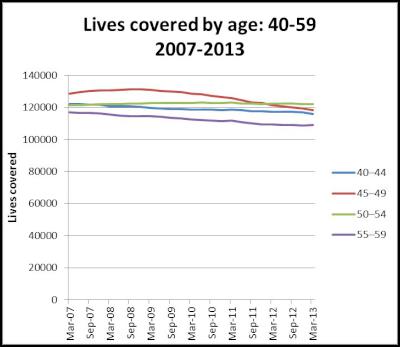
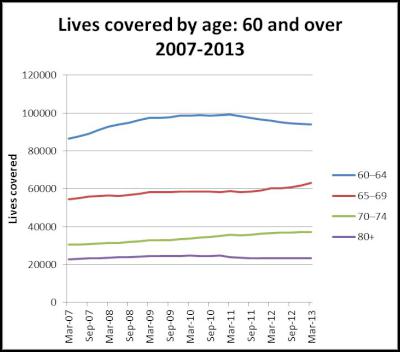
The charts below give an indication of
trends over the past six years for different age groups.
For most age groups, the past six years has seen either
relatively stable numbers or a slight reduction in lives
covered.
Premium
income
Premium income for the March 2013 quarter
totalled $280 million. This was up 1.3 percent on the
December 2012 quarter, or up 3.6 percent compared to the
previous March quarter.
Annual premium for the year ended 31 March 2013 was $1.102 billion, up 4.6 percent on premium income for the March 2012 year.
Claims
paid
Claims paid for the March 2013 quarter
totalled $199 million, up 1.8 percent on claims paid in the
previous March 2012 quarter. Claims paid for the 12 months
ending 31 March 2013 were $880 million, up 4.2 percent on
March 2012 year claims.
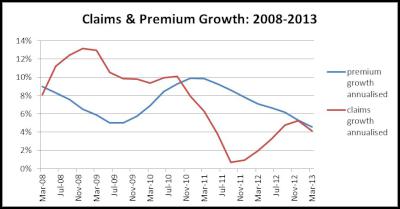
Annual growth in claims paid has moderated since 2010, due to a range of factors including an overall reduction in lives covered, together with lower levels of health inflation.
Over time, the annualised growth in claims cost and premium income are broadly similar, although they may differ from year to year. A comparison of the past five years shows this, with claims growth demonstrating a greater level of volatility over the period.
Click for big version.
ENDS


 Air New Zealand: Raw Thrills - Air New Zealand's Most Popular Inflight Entertainment Revealed
 Hustle Management: Celebrating 50 Years Of Music, Now And Then, With Mark Williams
 Massey University: Birdnapped Cockatoo Wins Quote Of The Year
 LAWA: “Know Before You Go” – Check Summer Swimming Water Quality Online
 Official Aotearoa Music Charts: 2024 End Of Year Charts Have Been Published
 Nielsen Book NZ: Nielsen BookData Announces 'In Too Deep' Is The Official New Zealand Number 1 Christmas Bestseller