Health & Wealth Disparities - Otago Uni. Research
Death rates fell for all income groups during the 1980s and 1990s …. but relative gaps in death rates between rich and poor still widened.
New Zealanders have enjoyed mortality rate reductions during the 1980s and 1990s but the gains were greater among those on high incomes, according to major new research released today.
The research findings show that if low and middle income groups had enjoyed the same death rate as the high income group in the late 1990s there would have been about 3,600 fewer deaths per annum among 25-77 year olds, says lead author Associate Professor Tony Blakely of the University of Otago.
“This number of deaths is similar to the mortality burden from tobacco,” says Associate Professor Blakely.
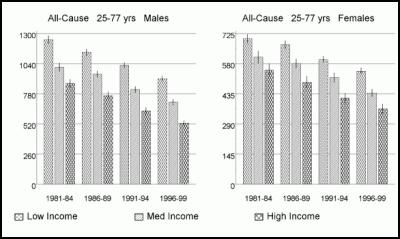
Comparing the third of the adult New Zealanders with lowest incomes to the third of the population with highest incomes, disparities in mortality rates among men increased from 43 per cent in 1981-94 to 72 per cent in 1996-99, and from 27 per cent to 50 per cent among women, he says.
“While there is good news in that all socio-economic groups enjoyed improvements in mortality, this is overshadowed by bad news of a near doubling in the relative disparity in death rates between the rich and poor,” he says.
The research, launched by the Minister of Health, Hon Annette King, today and published jointly by the University and Ministry of Health as a report Decades of Disparity II: Socio-economic mortality trends in New Zealand, 1981-99, follows previous research on ethnic disparities by the same joint of University of Otago researchers and Ministry of Health analysts. The research released today speaks to socio-economic inequalities in health that apply similarly to all ethnic groups in New Zealand. Furthermore, this new report clearly shows that there are both:
- large ethnic differences in death rates
even within socio-economic groups
- large socio-economic
differences in death rates within all ethnic groups.
“That is, both ethnicity and socio-economic status matter,” says Associate Professor Blakely.
Key findings from the
report:
- Among 25-44 year olds, the low-income group
actually had no reduction in death rates. Yet middle and
high-income 25-44 year olds enjoyed good falls in death
rates. Thus, disparities in mortality increased most
notably among young adults.
- Cardiovascular disease was
the major contributor to disparities in adult mortality.
But cancer deaths are becoming increasingly important
drivers of socio-economic disparities in mortality – both
lung cancer and other cancers.
- Suicide rates among
young adults increased most among lower socio-economic
groups during the 1980s and 1990s.
- Disparities by
socio-economic group in injury deaths were roughly similar
over the 1980s and 1990s, albeit with high-income and highly
educated groups tending to enjoy lower mortality rates at
all points in time.
The causes of the varying rates of decline in mortality by socio-economic group, and widening socio-economic inequalities in mortality, are many and occur at many levels. Three areas, however, stand out as possible places for action by policy makers, government sectors and other agencies:
1. Income
“Money can buy you better health by the ability to afford a healthier diet, live in a nicer neighbourhood, relieve stress by going on holidays, and so on. Therefore, it seems an inescapable conclusion that some of the increasing inequalities in health during the 1980s and 1990s were a result of increasing income gaps between the rich and poor,” says Associate Professor Tony Blakely. “Looking to the future, then, if the gaps in income between the rich and poor are closed, we should reduce (or at least slow down the increase in) health inequalities. Moreover, as differences in health exist right across the range of incomes (not just for the poor compared to the rich), the majority of the population stands to benefit in health terms.”
2. Heart disease
“Heart disease is still the major cause of death driving socio-economic disparities in mortality,” says Jackie Fawcett, co-author of the report. “We understand well the risk factors for developing heart disease, and we have many effective life-saving treatments for people who develop heart disease. But, during the 1980s and 1990s, higher socio-economic groups were more successful at adopting health-behaviours and accessing life-saving treatments that lessened their chance of dying of heart disease. To ensure that socioeconomic disparities do not continue to increase requires concerted action to ensure health promotion and medical interventions are equally effective and accessible for lower socio-economic groups.”
3. Cancer
“Socio-economic inequalities in cancer are increasing over time,” says Associate Professor Tony Blakely. “As with heart disease, the reasons for this can be found both in lifestyles and access to life-saving treatments. The advent of the Cancer Control Strategy in New Zealand, with a major focus on reducing inequalities in the impact of cancer, provides an opportunity for concerted action to reduce inequalities – from prevention to treatment to palliative care.”
The report is a joint report between the researchers at the Wellington School of Medicine and Health Sciences of the University of Otago and the Ministry of Health. The New Zealand Census-Mortality Study, from which the work arose, is funded by the Health Research Council and the Ministry of Health, and conducted in collaboration with Statistics New Zealand.
Date
of launch: 20 April 2005
Time: 1.30 pm
Place: Ministry
of Health, Old Bank Building, Wellington
ADDITIONAL
INFORMATION
The report “Decades of Disparity II:
Socio-economic mortality trends in New Zealand, 1981-1999”
can be found at
either:
www.wnmeds.ac.nz/nzcms-info.html
www.moh.govt.nz/
A
table builder that allows anyone to create a range of graphs
and tabular output on socio-economic mortality trends in New
Zealand can be found
at:
www.otago.ac.nz/NZCMSWebTable/
or linked from the
main NZCMS
website:
www.wnmeds.ac.nz/nzcms-info.html
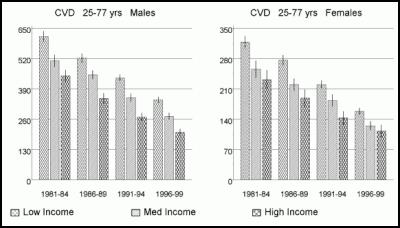
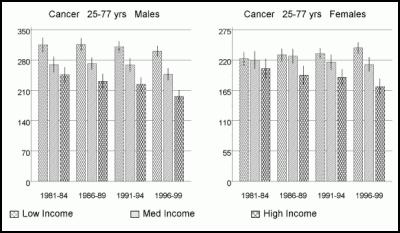
Below are three main graphs showing mortality rates over time and by income in New Zealand, for all-cause mortality, cardiovascular disease mortality and cancer. Fuller data (e.g. rates, relative risks, and text commenting on these gaps can be found in the report “Decades of Disparity II: Socio-economic mortality trends in New Zealand, 1981-1999”).

Cardiovascular Disease Mortality
Rates per 100,000 (vertical y-axis) by Income Group by
Period
Total Cancer Mortality
Rates per 100,000 (vertical y-axis) by Income Group by
Period


 Royal Commission Covid-19 Lessons Learned: Public Submissions To The COVID-19 Inquiry Close On Sunday 27 April 2025 At Midnight
 Te Whatu Ora Health New Zealand: Low Risk To Public Health Following Fire At South Taranaki Hotel
 NZCTU: Govt Vocational Education Reforms Will Cause Massive Disruption
 NZ Liberation Museum - Te Arawhata: Anzac Day Commemorations In France To Remember All New Zealand Soldiers
 Royal Commission Covid-19 Lessons Learned: We Want To Hear From As Many People As Possible, Says COVID-19 Inquiry Chair
 My ECE: Parents Reject ECE Deregulation - 'Children’s Safety Is Not Optional'