Kiwi Consumers Are Spending About The Same As Last Year, But Getting Less For Their Money
AUCKLAND, 5 July 2022 – New consumer spending data released by Worldline NZ today suggests Kiwis are spending about the same as they were a year ago but getting less for their dollar – while the first Matariki long-weekend provided a welcome boost for the Hospitality sector in the regions.
Consumer spending through Core Retail merchants (excluding Hospitality) in Worldline NZ’s payments network reached $2.76B in June 2022, up just 1.0% on June last year. While this is higher than figures recorded last year, the rate of spending growth is well below the latest reported annual inflation rate of 6.9%.
Worldline’s Head of Data, George Putnam, says that these comparative figures clearly point to the slowness of the current economy.
“With spending lifting only marginally above year-ago levels while inflation is running somewhat higher suggests people are having to cut back on the amount they purchase,” he says.
“Our data suggest this is happening to a degree across all sectors, but it has been enough to push spending significantly below year-ago levels in some merchant sectors.”
Putnam says the largest annual sectoral decline in spending, in dollar terms, was seen in the large Hardware / Furniture category, which was down -5.5% from June 2021 to June 2022.
However, he notes that spending amongst Hospitality merchants reached $881m in June, which is up 5.2% on the pre-Covid levels of June 2019, although still 3.1% below 2021 levels.
“It’s encouraging to see spending within the Hospitality sector continue to recover gradually, especially in surpassing pre-Covid levels in May and June 2022 – and following the previous tough nine months that began with Level 4 lockdowns in August 2021.”
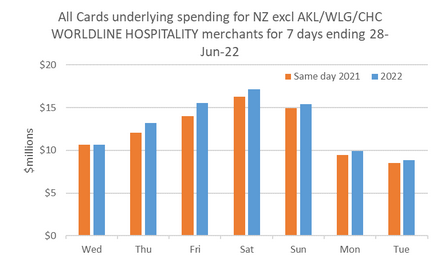
Putnam also notes that the first Matariki long-weekend provided a welcome boost to regional cafés, restaurants, hotels and motels, with spending through these merchants reaching $112m – up 0.9% on the same non-holiday Friday-Sunday of 2021 and 12.8% on the same weekend in 2019.
“Mid-winter clearly did not deter New Zealanders from getting out of the cities to enjoy the first of the Matariki holidays,” he says.
“An extra 6.5% (+$3m to give a 3-day total of $48m) found its way into the regional Hospitality providers over the three days of Matariki weekend, while Auckland/Northland and Canterbury experienced lower Hospitality spending over the weekend.
“Wellington meanwhile was up on last year, but that had more to do with Covid constraints last year than Matariki celebrations this year,” says Putnam.
The following graph shows spending through regional Hospitality merchants over Matariki long-weekend, outside the three largest cities of Auckland/Northland, Wellington, and Christchurch.

Figure 1: All Cards underlying* daily spending through Worldline for Core Retail excluding hospitality merchants for 7 days ending Wednesday 28 June in NZ regions excluding Auckland/Northland, Wellington and Christchurch (* Underlying excludes large clients moving to or from Worldline)
Meanwhile, wider spending across all Core Retail merchants (excluding Hospitality) showed annual growth was highest in Taranaki (+4.9%) and Canterbury (+4.3%). Spending was below year-ago levels in Auckland/Northland (-0.6%), Wellington (-0.9%), Nelson (-1.0%) and Otago (-0.1%), while spending remains above pre-Covid levels in all regions.
| WORLDLINE All Cards underlying* spending for CORE RETAIL less HOSPITALITY merchants for June 2022 | |||
| Value | Underlying* | Underlying* | |
| Region | transactions $millions | Annual % change on 2021 | Annual % change on 2019 |
| Auckland/Northland | 1,018 | -0.6% | 8.6% |
| Waikato | 220 | 3.5% | 18.9% |
| BOP | 188 | 3.8% | 18.1% |
| Gisborne | 27 | 0.5% | 12.6% |
| Taranaki | 64 | 4.9% | 26.5% |
| Hawke's Bay | 96 | 3.2% | 20.3% |
| Wanganui | 35 | 3.0% | 23.5% |
| Palmerston North | 83 | 1.1% | 19.3% |
| Wairarapa | 35 | 2.6% | 26.0% |
| Wellington | 268 | -0.9% | 8.5% |
| Nelson | 53 | -1.0% | 11.9% |
| Marlborough | 32 | -0.8% | 15.3% |
| West Coast | 18 | 3.4% | 21.4% |
| Canterbury | 334 | 4.3% | 18.9% |
| South Canterbury | 46 | 2.9% | 20.1% |
| Otago | 141 | -0.1% | 11.1% |
| Southland | 62 | 2.0% | 13.3% |
| New Zealand | 2,762 | 1.0% | 12.9% |
Figure 2: All Cards NZ annual underlying* spending growth through Worldline June for regional core retail excluding hospitality merchants (* Underlying excludes large clients moving to or from Worldline)


 Parrot Analytics: Netflix Earnings - Price Hikes With Minimal Churn | Will Netflix Be A Bright Spot For Markets?
 Canterbury Museum: Mystery Molars Lead To Discovery Of Giant Crayfish In Ancient Aotearoa New Zealand
 Ngā Pae o te Māramatanga: Māori Concerns About Misuse Of Facial Recognition Technology Highlighted In Science
 Retail NZ: Retailers Call For Flexibility On Easter Trading Hours
 WorkSafe NZ: Worker’s Six-Metre Fall Prompts Industry Call-Out
 PSGR: Has MBIE Short-Circuited Good Process In Recent Government Reforms?


