Shocking Stuff: Consumers In Lower Income Areas Paying More For Power
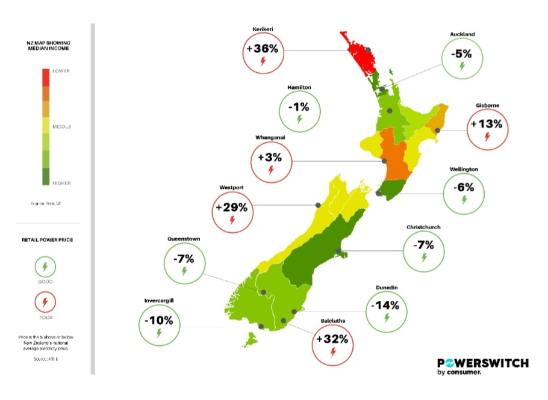
Analysis from Consumer NZ and Powerswitch has found major differences in electricity pricing depending on where you live, with those in lower income areas being hit the hardest.
Those who live in Kerikeri, for example, are charged 40% more on average than a similar household in Auckland (where incomes are approximately 25% greater). Prices in Masterton are 15% higher than they are just over the hill in Wellington.The price in Westport, which has lower-than-average incomes,is close to 40% higher than in Christchurch, which on average has higher incomes.
“It’s a tragedy that those in lower income areas are having to pay more for what we regard as an essential service. The price disparity between lower and higher income areas is contributing to inequality and energy hardship," Powerswitch manager Paul Fuge said.

Regions that have higher prices tend to have lower population density, are further away from power stations, or have few large commercial electricity users. With a typical power bill, about 40% of the payment is electricity lines charges – which is the cost of the infrastructure required to get electricity from the power station to your home – so there are fewer households and businesses to spread these costs over. Unfortunately, many of the consumers in these areas also have lower-than-average incomes.
Consumer NZ analysis has found that regions with high prices are also areas where large numbers of consumers have either never changed electricity providers or have done so seldomly. These regions are more likely to be dominated by a single electricity retailer.
“Competition in electricity helps keep a lid on power prices. However, recently we've seen some of the smaller more competitive retailers leave Powerswitch. High wholesale electricity prices have resulted in them pausing taking on new customers,” Fuge said.
Analysis ofabout 7000Powerswitchresults pages generated overwinterin 2021indicated that median savings in switching to the cheapest pricing plan were$310.
Notes on data sources: Representative electricity prices for each location were derived from the Ministry of Business Innovation and Employment (MBIE) quarterly survey of domestic electricity prices. TheMBIEsurvey finds a representative price for a typical New Zealand householdfortowns and citiesacross New Zealand.Income data were sourced from Stats NZ. Retailer switching and retailer market share data was sourced from the Electricity Authorityand Powerswitch records.


 Financial Markets Authority: Westpac Admits To Misleading Representations That Resulted In $6.35m In Overcharges
 Bill Bennett: Download Weekly - Review Of 2024
 Bill Bennett: One NZ scores worldwide first as Starlink direct-to-mobile launches
 Hugh Grant: How To Reduce Network Bottlenecks
 Dominion Road Business Association: Auckland Transport's 'Bus To The Mall' Campaign: A Misuse Of Public Funds And A Blow To Local Businesses
 Parrot Analytics: A Very Parrot Analytics Christmas, 2024 Edition


