 Scoop has an Ethical Paywall


Lack Of Properties For Sale Is Putting Pressure On House Prices & Speeding Up Sales, Says REINZ
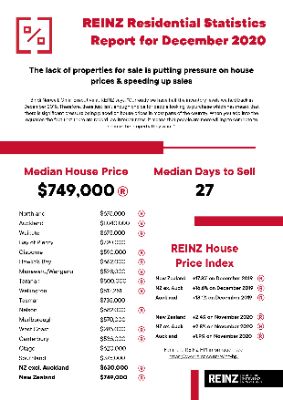
As the total pool of properties available for sale in New Zealand falls to record lows, this is continuing to put pressure on house prices, with the country seeing a new record median house price for the fourth month in a row according to the latest data from the Real Estate Institute of New Zealand (REINZ), source of the most complete and accurate real estate data in New Zealand.
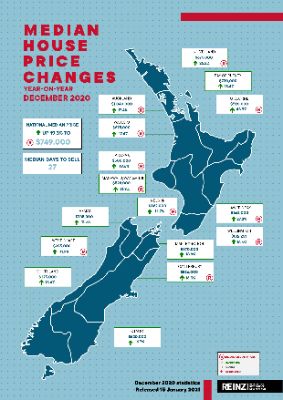
Median house prices across New Zealand increased by 19.3% from $628,000 in December 2019 to a new record median price of $749,000 in December 2020.
Median house prices for New Zealand excluding Auckland increased by 17.8% from $535,000 in December last year to a new record median price of $630,000.
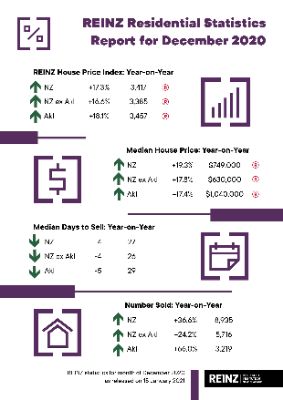
Additionally, Auckland’s median house price increased by 17.4% from $886,000 at the same time last year to $1,040,000 a new record high – the fifth consecutive month where Auckland has seen a new record median house price.
In total 11 regions saw record median prices during December 2020. Regions in addition to Auckland with record median prices were:
- Gisborne with a 43.9% increase from $410,000 in December 2019 to $590,000 in December 2020
- West Coast with a 31.9% increase from $216,000 in December 2019 to $285,000 in December 2020
- Manawatu/Wanganui with a 31.3% increase from $402,000 in December 2019 to $528,000 in December 2020 – the sixth consecutive month of record median prices
- Hawke’s Bay with a 27.3% increase from $520,000 in December 2019 to $662,000 in December 2020
- Northland with a 25.2% increase from $539,000 in December 2019 to $675,000 December 2020
- Taranaki with a 19.6% increase from $418,000 in December 2019 to $500,000 in December 2020
- Wellington with an 18.6% increase from $685,000 in December 2019 to $812,251 in December 2020
- Waikato with a 17.4% increase from $575,000 in December 2019 to $675,000 December 2020 – the eighth month in a row of record high medians
- Canterbury with a 16.5% increase from $460,000 in December 2019 to $536,000 in December 2020 – the fifth consecutive month of record median prices
- Nelson with a 12.7% increase from $605,000 in December 2019 to $682,000 in December 2020.
Bindi Norwell, Chief Executive at REINZ says: “For the fourth month in a row, New Zealand has seen house prices reach a new record; with December seeing a new national median house price of $749,000. Additionally, 11 regions and 27 districts saw record high median prices – a continuation of the pattern we’ve seen in the housing market for the last few months – highlighting how strong the residential housing market is in all parts of the country.
“Currently we have half the inventory levels we had back in December 2018. Therefore, there just isn’t enough choice for people looking to purchase which has meant that there is significant pressure being placed on house prices in most parts of the country. When you add into the equation the fact that there are record low interest rates, it means that people are more willing to compete to secure the property they want,” continues Norwell.
“This lack of choice and high levels of confidence is also causing properties to be sold at the quickest pace we’ve seen in 17 years. The median number of days to sell a house is now just 27 days, showing how people are moving quickly to secure ‘good’ properties,” she points out.
“Auckland City remains New Zealand’s most expensive district in the country with December seeing the City reach a new record median house price of $1,280,000 – hovering extremely close to the $1.3 million mark. Not far behind, was North Shore City on $1,235,000 and Rodney District on $1,005,000 showing how unaffordable the Auckland region is becoming – especially for first home buyers. The only district in Auckland now with a median under the $800,000 mark is Franklin District with a median of $790,000; while it might be the most ‘affordable’ area in Auckland, it does mean a significant commute to the city for those looking to purchase there,” she continues.
“Today’s figures further highlight that we urgently need a combined response from Government and industry to solve the housing affordability issues the country is facing,” says Norwell.
Highest number of properties sold in NZ in a December month, ever
The number of residential properties sold in December 2020 across New Zealand increased by 36.6% from December 2019 (from 6,543 to 8,935) – the highest number of properties sold in a December month ever.
For New Zealand excluding Auckland, the number of properties sold increased by 24.2% when compared to the same time last year (from 4,604 to 5,716).
In Auckland, the number of properties sold in December increased by 66.0% year-on-year (from 1,939 to 3,219) – the highest for the month of December since records began.
In addition to Auckland, regions with the largest increase in annual sales volumes during December were:
- West Coast: +55.3% (from 38 to 59 – 21 more houses) – the highest for the month of December in 14 years
- Canterbury: +45.6% (from 934 to 1,360 – 426 more houses) – the highest for the month of December since records began
- Waikato: +39.5% (from 641 to 894 – 253 more houses) – the highest for the month of December in 16 years
- Gisborne: +31.3% (from 48 to 63 – 15 more houses)
- Taranaki: +29.2% (from 144 to 186 – 42 more houses).
Regions with annual decreases in sales volumes were:
- Marlborough: -14.9% (from 87 to 74 – 13 fewer houses)
- Tasman: -14.3% (from 77 to 66 – 11 fewer houses)
- Nelson: -3.7% (from 82 to 79 – 3 fewer houses).
“If 2020 taught us anything, it was that the unusual can happen. Looking at December’s sales data again proves this point, as we saw the highest number of properties sold in a December month since REINZ began keeping records,” says Norwell.
“December 2020 saw 8,935 properties sold which is 2,392 more houses than the same time last year. That’s an additional 77 properties sold every single day in December, which is a pretty remarkable result and shows what a strong position the property market finished 2020 in,” continues Norwell.
“Again, the Auckland market has seen the largest percentage increase in sales volumes when compared to the same time last year, and December marked the fourth consecutive month where the annual change in sales volume increases exceeded the 50% mark. Looking at the seasonally adjusted figures for annual sales volumes for Auckland confirms that this was an exceptional month,” points out Norwell.
“Similar to what we’ve seen in the past few months, with market confidence high, buyers are likely to be keen to purchase ahead of further anticipated price rises and the re-introduction of the LVRs. Therefore, we would expect that the housing market will be busy for the next few months. However, if we don’t see more stock come to the market, we may start to see this impact sales volumes going forward,” concludes Norwell.
REINZ HPI for Gisborne/Hawke’s Bay lifts by a quarter in December
The REINZ House Price Index (HPI) for New Zealand, which measures the changing value of property in the market, increased 17.3% year-on-year to 3,417 a new high on the index – the highest annual percentage increase in 63 months (September 2015).
Additionally, 11 out of 12 regions had double-digit annual growth figures – the first time in 15 years the index has been this strong.
The HPI for New Zealand excluding Auckland showed house price values increased 16.6% from December 2019 to 3,385 a new high for December 2020.
Auckland’s house price values increased 18.1% year-on-year to 3,457 also a new high for the index and the largest annual percentage increase we’ve seen for the region in 61 months (November 2015).
In December, Gisborne/Hawke’s Bay again had the highest annual growth rate in house price values with a 24.8% increase to a new record index level of 3,780. Again, in second place was Wellington with an annual growth rate of 20.5% to a new record index level of 3,509 and in third place was Manawatu/Wanganui with a 20.4% annual increase in house price values.
Median days to sell lowest in 204 months
In December, the median number of days to sell a property nationally decreased 4 days from 31 to 27 when compared to December 2019, the lowest in 204 months (since December 2003).
Across the country, 14 out of 16 regions had a median number of days to sell of less than 30 days which is the highest on record. Only Northland and the West Coast were exceptions.
For New Zealand excluding Auckland, the median days to sell decreased by 4 days from 30 to 26.
Auckland saw the median number of days to sell a property decrease by 5 days from 34 to 29, the lowest for the month of December in 17 years.
Taranaki had the lowest days to sell of all regions at 20 days – down 7 days from the same time last year. This was the lowest days to sell for Taranaki since records began. Additionally, Waikato (24), Bay of Plenty (27) and Manawatu/Wanganui (21) had record low median days to sell.
Percentage of auctions continues to climb & West Coast has first auction in 3 years
December saw 27.9% of all properties sold by auction, with 2,494 properties selling under the hammer – up from 13.6% at the same time last year, when 892 properties were sold via auction and up from 26.5% in November 2020. This was the highest percentage of auctions the country has seen in 63 months.
New Zealand excluding Auckland had the highest percentage of sales by auction on record with 17.4% of properties sold by auction, up from 8.1% in December 2019.
The West Coast had its first property sold by auction since November 2017.
Gisborne had the highest percentage of auctions across the country with 68.3% (43 properties) sold under the hammer, up from 50.0% (24 properties) in December 2019.
Auckland had the second highest percentage of auctions in New Zealand with 46.6% of properties (1,501 properties) sold under the hammer in December up from 26.8% at the same time last year (519 properties). This was the highest percentage of properties sold by auction in Auckland in 52 months (August 2016).
In third place was Bay of Plenty with 34.2% (202 properties) sold under the hammer up from 13.1% in December 2019 (67 properties).
Inventory levels at lowest point ever
The total number of properties available for sale in New Zealand decreased by -29.1% in December to 12,932 – the lowest level of inventory ever. This was down from 18,230 in December 2019 – a decrease of 5,298 properties compared to 12 months ago. Additionally, every region – except Auckland and Gisborne - had their lowest levels of inventory ever.
Regions with the largest percentage decrease in total inventory levels were:
- Nelson: -49.1% from 352 to 179 – 173 fewer properties
- Marlborough: -49.0% from 245 to 125 – 120 fewer properties
- Manawatu/Wanganui: -48.3% from 609 to 315 – 294 fewer properties.
Wellington had the lowest number of weeks’ inventory with only four weeks’ inventory available to prospective purchasers. This is a record low level of inventory for any region since records began and highlights how we desperately need new listings to come onto the market in some parts of the country.
Northland and West Coast had the highest number of weeks’ inventory with 17 weeks’ inventory available to prospective purchasers down from 43 and 59 weeks respectively at the same time last year.
Price Bands
The number of homes sold for less than $500,000 across New Zealand fell from 32.1% of the market (2,099 properties) in December 2019 to 19.3% of the market (1,721 properties) in December 2020.
The number of properties sold in the $500,000 to $750,000 bracket fell from 33.0% (2,158 properties) to 30.8% (2,752 properties).
At the top end of the market, the percentage of properties sold for $1 million or more increased from 16.4% (1,071 properties) in December 2019 to 27.9% (2,493 properties) in December 2020.
 Alcohol Beverages Council: Turning The Tide - New Zealanders Unite To Curb Harmful Drinking
 University of Auckland Business School: Economists Urge Action To Prevent ‘AI Poverty Traps’
 Bill Bennett: Australian warship takes rural fixed wireless broadband offline
 NZ Telecommunications Forum - TCF: New Zealand Is Saying Goodbye To 3G: Are You Ready For The Change?
 NZ Post: Mānawatia A Matariki - NZ Post Stamps Look To The Stars Ahead Of The Māori New Year
 Waipa Networks: Cambridge Is Open For Business With $45M Energy Boost