 Scoop has an Ethical Paywall


A Year Of Two Quarters
Retailers using the Paymark network know that 2020 was a tough year for many but by December for a number at least, the year ended on a high note.
The June quarter, which included Level 4 nationwide lockdown, saw payments through Paymark via an underlying set of Core Retail merchants drop 15.5% from a year earlier in dollar terms. By the December quarter that had completely reversed and year on year December 2020 was up by 5.0% over December 2019.
For the year in total, Core Retail spending was $42.6 billion through Paymark, an underlying increase of just 0.1%. Not surprising in view of COVID-19, the average spend on each transaction across all cards increased, from $39.04 to $42.58.
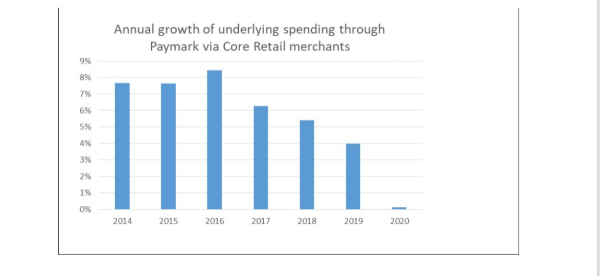
Figure 1: Annual All Cards NZ underlying* spending through Paymark for NZ core retail merchants in recent years
* Underlying spending excludes large clients moving to or from Paymark
Dig below the total, though, and some very mixed merchant experiences emerge. Within the Core Retail sector there are three large groups. There are the stores selling food and liquor, and spending remained strong for this group throughout the year, with an 11.5% growth rate for the 12 months.
Conversely spending through hospitality merchants was down 4.5% for the year. The hospitality sector can be split further into Accommodation providers, some of which also serve food and liquor, and the larger Food and Beverage Services sector, which includes cafes, bars, and takeaways. The Food and Beverage Services subset did experience a decline in spending (-12.1%) for the year but were again posting annual spending growth by the December quarter (+2.7%). Payments through Paymark for Accommodation merchants were down 30% for the year and were still running at this level in the December quarter.
The third group that makes up the Core Retail sector are merchants who generally sell the day-to-day goods that we all require. This includes clothes, computers, couches and cosmetics to name just a few. These merchants recorded a decline in spending of 3.2% for the year but growth had also resumed in the December quarter, in this case to 6.7%.
The diversity of experiences also shows in the regional spending patterns through Paymark. Spending for the year was down in the Paymark-defined regions of Auckland/Northland (-3.2%), Otago (-7.1%) and Southland (-1.9%) but up in some of the smaller North Island regions such as Wairarapa (+10.7%), Wanganui (+7.9%), Gisborne (+6.2%), Taranaki (+6.0%) and Hawke’s Bay (+6.0%).
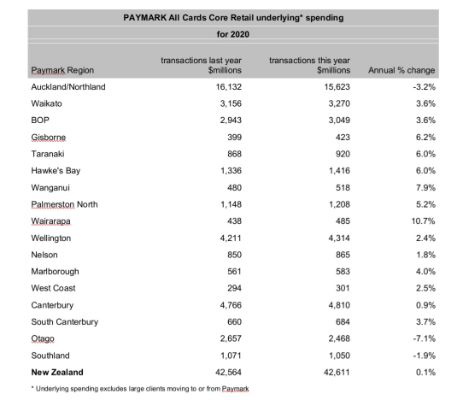
Figure 2: All Cards NZ annual underlying spending growth through Paymark for 2020 for Regional core retail merchants
By the December quarter, Auckland/Northland Core Retail merchants had resumed spending growth while their peer group in Otago (-5.3%) and Southland (-1.8%) remained below year-ago levels. With the exception of the West Coast (+1.6%), all other regions were recording higher growth rates in the last quarter of 2020 – a promising way to approach a new year.
 Bill Bennett: Download Weekly - Review Of 2024
 Bill Bennett: One NZ scores worldwide first as Starlink direct-to-mobile launches
 Hugh Grant: How To Reduce Network Bottlenecks
 Dominion Road Business Association: Auckland Transport's 'Bus To The Mall' Campaign: A Misuse Of Public Funds And A Blow To Local Businesses
 Parrot Analytics: A Very Parrot Analytics Christmas, 2024 Edition
 Financial Markets Authority: Individual Pleads Guilty To Insider Trading Charges


