Hatches and despatches – who does what in New Zealand?
14 November 2019
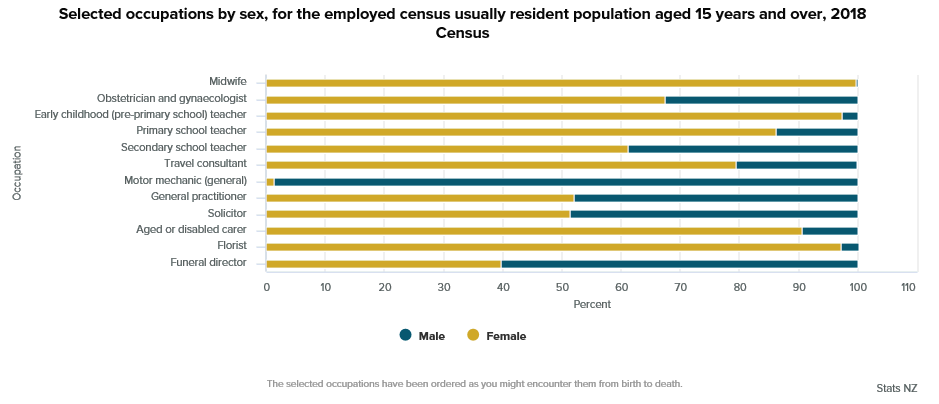
New Zealand babies are most likely to be helped into the world by a female midwife, according to the 2018 Census, and young children are far more likely to be taught by women, Stats NZ said today.
But our homes are most often built by men and our cars fixed by a male motor mechanic. Men are also more likely to be funeral directors.
“There were more than 1,000 different occupations listed in the 2018 Census,” census general manager Kathy Connolly said.
“The list of occupations runs right through the alphabet from archaeologists (144) and blacksmiths (180) to youth workers (2,379) and zookeepers (258).”
There were 2,742 midwives, supporting mothers through their pregnancies, and almost all of them were women (99.7 percent). There were also 138 obstetricians and gynaecologists, of which 67.4 percent were women.
Primary school teachers were also predominantly women (more than 80 percent), though at secondary schools, men made up almost 40 percent of teaching staff.
“There are slightly more female than male solicitors and GPs in New Zealand,” Ms Connolly said.
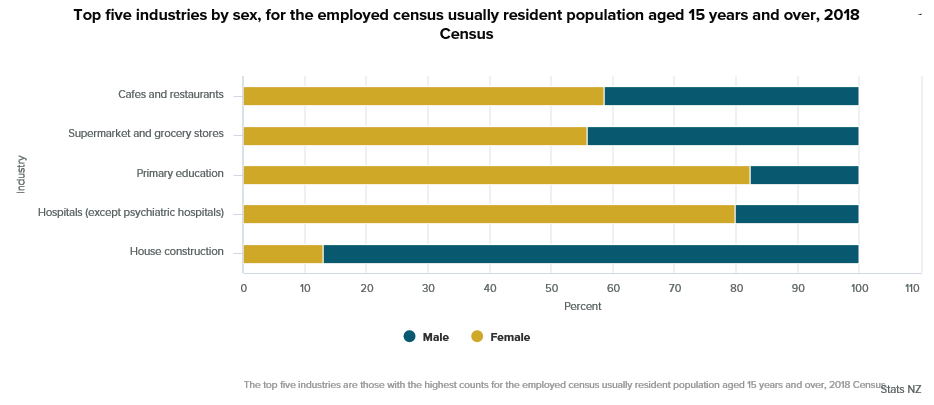
“However, in the home-building industry, which includes occupations such as construction project manager and builder’s labourer, almost 9 in 10 workers are men.”
“When life comes to an end, people are more likely to be laid to rest by a man, with around 60 percent of funeral directors being men. If you need flowers for the funeral, there are more than 1,400 florists in New Zealand, and almost all of them (97.2 percent) are women.”
Occupations to help you through
life
• 2,742 midwives
• 138 obstetricians
and gynaecologists
• 30,798 early childhood
teachers
• 33,519 primary school teachers
• 24,996
secondary school teachers
• 4,833 travel
consultants
• 14,955 motor mechanics
• 5,616
general practitioners (GPs)
• 11,865
solicitors
• 9,888 aged or disability
carers
• 1,410 florists
• 612 funeral
directors.
•

A nation of shopkeepers and managers
In the 2018 Census, the most common occupations for employed adults (aged 15 years and over) were:
• sales assistant – general (108,702
people or 4.4 percent of employed adults)
• office
manager (65,907 people or 2.7 percent of employed
adults)
• chief executive or managing director (54,480
people or 2.2 percent of employed adults). Around one in
five people in this occupation also reported that they were
self-employed without employees.
Sales assistants (general) are most likely to be women (61.4 percent) and relatively young, with a median age of 29.5 years. Office managers are also most likely to be women (91.0 percent), with a median age of 47.2 years, while chief executives or managing directors are most likely to be men (70.3 percent) and older, with a median age of 51.1 years.
The two most common industries in which people worked in 2018 related to the food trade: cafes and restaurants, with 67,608 people or 2.8 percent of employed adults, and supermarket and grocery stores, with 57,609 people or 2.4 percent of employed adults. Rounding out the top five industries were primary education (55,779 or 2.3 percent), hospitals (excluding psychiatric hospitals) (52,887 or 2.2 percent), and house construction (51,804 or 2.1 percent).
The industry with the highest number of employed women was primary education (45,846 or 4.0 percent of employed women). This reflects the large number of people in this industry and the higher proportion of women in occupations such as primary school teachers and intermediate school teachers.
The industry with the highest number of employed men was house construction (45,114 or 3.5 percent of employed men).
The top three industries for employed women were:
• primary education (45,846 or 4.0 percent
of employed women)
• hospitals (except psychiatric
hospitals) (42,207 or 3.6 percent of employed
women)
• cafes and restaurants (39,639 or 3.4 percent
of employed women).
The top three industries for employed men were:
• house construction (45,114 or 3.5 percent of
employed men)
• computer system design and related
services (29,844 or 2.3 percent of employed men)
• road
freight transport (28,515 or 2.2 percent of employed
men).

About occupation and industry data
An occupation is defined as a set of jobs that require the performance of similar or identical sets of tasks by employed people aged 15 years and over.
Industry is defined as the type of activity undertaken by the organisation, enterprise, business, or unit of economic activity that employs one or more people aged 15 years and over.
The data included in this release is at the lowest, most detailed level of both the occupation classification and the industry classification.
For occupation, 79.7 percent of responses were from the 2018 Census individual form. For the remaining people, we used imputation (20.3 percent) to fill in all missing values based on responses of similar people in the 2018 Census. For industry, 71.6 percent of responses were from the 2018 Census individual form. We used administrative data (20.8 percent) and imputation (7.7 percent) to fill in the missing values for the remaining people. The source of administrative data for industry was Individual tax return (IR3) and Employer Monthly Schedule (EMS) data from Inland Revenue.
The overall quality rating for occupation is moderate quality and for industry it is high quality (see Data quality assurance for 2018 Census). Our tool DataInfo+ has more information and definitions on Occupation, and Industry. The quality rating of a variable provides an overall evaluation of data quality for that single variable. Data quality may vary at smaller statistical geographies, lower levels of the classification of the variable, subpopulations, or when cross-tabulated with other variables.
About the 2018 Census dataset
We combined data from the census forms with administrative data to create the 2018 Census dataset, which meets Stats NZ’s quality criteria for population structure information.
We added real data about real people to the dataset where we were confident the people should be counted but hadn’t completed a census form. We also used data from the 2013 Census and administrative sources and statistical imputation methods to fill in some missing characteristics of people and dwellings.
An independent panel of experts has assessed the quality of the 2018 Census dataset. In its Initial report of the 2018 External Data Quality Panel, the panel endorsed the overall methods Stats NZ used for the 2018 Census and assessed the quality of some of the key variables. Its assessment of many other variables will be available in its final report due in December.
The Government Statistician authorises all statistics and data we publish.
For more information about these statistics:
• Visit Hatches and despatches – who does what in New Zealand?
ends


 NZGDA: NZ Game Development Industry Reports 26% Growth, Achieving NZD 548 Million In Revenue For 2023/2024
 Alcohol Healthwatch: New Factsheet A Reminder That Healthier Environments Reduce Cancer
 NIWA: Clever Sleuthing Unmasks Mystery Ocean Creature
 Rocket Lab: Opening Up Access To Science Education - Rocket Lab Scholarship Applications Now Open
 The Reserve Bank of NZ: Transmission Of Monetary Policy To Financial Conditions- A Speech By Assistant Governor Karen Silk
 KiwiRail: KiwiRail's Great Journeys New Zealand Wins Prestigious Best Design Awards


