 Scoop has an Ethical Paywall


NZ house prices increasing, led by strong regional growth
NZ house prices still increasing, led by strong regional growth
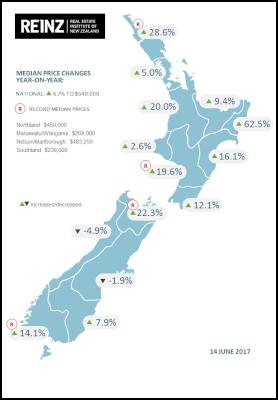
National median house prices increased 6.7% to $540,000 (up from $506,100) in the year to May 2017, according to the latest data from the Real Institute of New Zealand (REINZ) – source of the most complete and accurate real estate data in New Zealand. Seasonally adjusted, this increase is 6.2%.
Bindi Norwell, Chief Executive Officer at REINZ, says: “May housing activity clearly shows continued buoyant activity across a number of regions which contrasts with the continuing stability of the Auckland region. We saw record median prices achieved in 4 of the 14 regions we measure – Northland ($450,000), Manawatu/Wanganui ($269,000), Nelson/Marlborough ($483,250) and Southland ($238,000) – suggesting that the regions continue to hold up overall.
“Auckland median house prices increased 5% year-on-year to $865,000, showing continued growth in the Auckland housing market, albeit at a slower rate than the previous year. Compared to April it increased 1.6%,” continued Norwell.
HPI continues to show stable market
The REINZ HPI indicates that housing market activity nationwide year-on-year has lifted 5.0%, up in Auckland by 1.8% and outside Auckland by 11.1%. However, housing market activity month-on-month activity nationwide was down 0.4%, down 0.7% in Auckland and up 0.2% outside Auckland, indicating strong price growth in some regions and a stable market in Auckland.
Sales volumes decreasing
Sales volumes decreased on a
year-on-year basis nationally (-18.4%), in Auckland (-27.5%)
and outside Auckland (13.6%). On a seasonally adjusted
basis, this indicates a decrease nationally of
-22.2%,
in Auckland of -31.2% and national excluding Auckland of
-17.4%.
Inventory
The number of properties available for sale rose by 131 in May 2017 compared to 12 months ago, although:
- The number of
properties for sale in the Auckland region has increased by
2,814 (+47%).
-
- Outside Auckland the number of
properties for sale fell by 2,683 (-14%).
-
Compared to May 2016 the number of listings fell
0.7% in Canterbury, 6.9% in Wellington and 6.1% in Waikato.
The largest declines occurred in Northland (-607),
Manawatu/Wanganui (-571) and Otago (-302).
Auction rates
The number of dwellings sold by auction continues to decline across New Zealand with 956 properties sold by auction, in comparison to 1,982 in May 2016 – a decrease of 52%. Additionally, auctions accounted for 13% of total property sales, down from 22% in May 2016.
When looking at auctions across the regions, Auckland saw 536 auctions in May 2017 (down from 1277 a year ago, representing 24% of sales in May 2017 versus 42% in May 2016), while over the same period Waikato declined to 10% of sales versus 13%, Wellington stayed consistent with 6% of sales (up from 5%), and Canterbury decreased to 12% from 15%.
Days to sell lengthens
The median days to sell nationally increased by five to 37 days, compared to 32 days in May 2016. Regionally, Hawke’s Bay had the shortest median days to sell at 30 days followed by Wellington and Nelson/Marlborough at 31 days. Westland had the longest median days to sell at 196 days, followed by Taranaki at 42 days, while in Auckland the median days to sell was 40 days, 8 days longer than in May 2016.
“We are seeing a continuing trend of strong median house price growth in many of the regions year-on-year, however, a lack of inventory continues. In Auckland, with sales volumes down, inventory levels increasing, the number of days to sell increasing and the level of auctions decreasing you might have expected to see prices decreasing in Auckland – however, this is not the case,” points out Norwell.
“This can be explained by looking at the wider fundamentals currently at play in New Zealand. Given the considerable mismatch between population growth, increasing immigration figures, low interest rates, high housing demand and low building consents and housing supply, it’s clear why prices are still rising – although at single rather than double-digit growth levels.”
“We believe that overall buyers are being more cautious – we’re heading into winter which traditionally sees a slowdown in activity, we’re in an election year, some political uncertainty globally in some of our traditional trading markets and first-time buyers are finding access to capital more difficult. This goes some way to explaining the intricacies of what we’re currently seeing in the New Zealand market,” concludes Norwell.
Million-dollar home sales drop
Between May 2016 and May 2017, the number of homes sold for more than $1 million decreased from 1,240 to 1,066 sales, or 14.5% of all properties sold. The number of dwellings sold under $500,000 also declined - by 1,103 - between May 2016 and May 2017.
ENDS
 Great Journeys New Zealand: Scenic Plus Winter Menu Launched
 Tourism New Zealand: Tourism New Zealand Invites The World To Find Their 100% Pure New Zealand In New Global Campaign
 Bill Bennett: Comcom warns 2degrees over satellite marketing
 Transpower: Major Electricity Development For Western Bay Of Plenty A Step Closer
 Alcohol Beverages Council: Turning The Tide - New Zealanders Unite To Curb Harmful Drinking
 University of Auckland Business School: Economists Urge Action To Prevent ‘AI Poverty Traps’