Spending momentum maintained
Spending momentum maintained
5 January, 2016
The spending momentum of the last four years was maintained through the busy pre-Christmas period of 2016. Underlying spending growth through Paymark was 6.6% between December 2015 and December 2016. The value of transactions for the month totaled $5,936.8 million.
In seasonally adjusted terms, the November to December increase was a modest 0.1% but this follows a period of sustained growth during the previous eleven months.
Noticeably the annual underlying growth rate in December was higher in the regions away from the major cities, suggesting more time spent at the baches and beaches this Christmas. Underlying annual growth averaged 6.0% in the three largest regions and 7.8% in the other regions.
Highest annual underlying growth was recorded in Hawke’s Bay (+10.9%), particularly amongst Hawke’s Bay merchants in sectors such as Accommodation (+20.8%), Food and beverage services (+16.1%), Furniture and hardware (+18.4%) and Electrical and electronic retailing (+12.6%).
Conversely, the Paymark-defined Marlborough region – which includes Kaikoura – experienced a 1.0% annual underlying decline in the value of transactions. The drop amongst Marlborough Accommodation merchants through Paymark was 13.1%.
PAYMARK All Cards Data (Dec 2016 versus same month 2015)
| Volume | Underlying* | Value | Underlying* | |
| Region | transactions millions | Annual % change | transactions $millions | Annual % change |
| Auckland/Northland | 45.33 | 8.1% | $2,410.3 | 6.4% |
| Waikato | 8.80 | 8.8% | $432.1 | 7.6% |
| BOP | 8.07 | 10.7% | $410.6 | 9.9% |
| Gisborne | 1.19 | 7.5% | $52.6 | 3.5% |
| Taranaki | 2.52 | 7.0% | $119.8 | 5.9% |
| Hawke's Bay | 3.60 | 13.2% | $172.9 | 10.9% |
| Wanganui | 1.25 | 9.5% | $54.2 | 7.4% |
| Palmerston North | 3.64 | 10.1% | $181.6 | 9.0% |
| Wairarapa | 1.11 | 8.5% | $52.2 | 7.6% |
| Wellington | 11.54 | 7.8% | $539.4 | 6.5% |
| Nelson | 2.37 | 8.2% | $121.6 | 4.2% |
| Marlborough | 1.27 | 1.3% | $69.2 | -1.0% |
| West Coast | 0.72 | 8.9% | $39.7 | 7.5% |
| Canterbury | 12.67 | 7.1% | $647.2 | 4.0% |
| South Canterbury | 1.74 | 6.2% | $94.2 | 5.0% |
| Otago | 6.26 | 10.8% | $339.5 | 9.5% |
| Southland | 2.45 | 7.8% | $132.7 | 6.9% |
| New Zealand | 115.45 | 8.4% | $5,936.8 | 6.6% |
* Underlying spending excludes large clients moving to or from Paymark within last 12 months
Figure 1: Paymark All Cards data (December 2016 versus December 2015)
As usual, more spending in December was undertaken using EFTPOS/debit cards ($3,117.1 million) than with credit cards ($2,819.8 million), although the underlying annual growth in the value of spending with EFTPOS/debit cards (+2.5%) is below that of credit cards (+11.2%), in part due to contactless cards being offered by credit card companies.
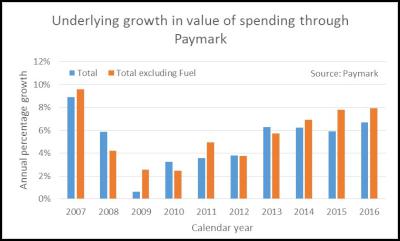
Over all 12 months of 2016, Paymark processed 1.2 billion transactions for $57.4 billion of goods and services. The underlying growth rate for 2016 was 6.7%, marking the fourth consecutive year of strong growth. This general spending growth is even more evident when transactions at fuel service stations are excluded as annual underlying non-fuel spending growth was 7.9% in 2016.

Figure 2: Underlying spending
through Paymark by year
These annual totals translate to averages of 255 transactions per person and $12,230 spending per person in 2016. The underlying annual growth rates in 2016 were 6.1% more transactions per person and 4.5% more spending per person.
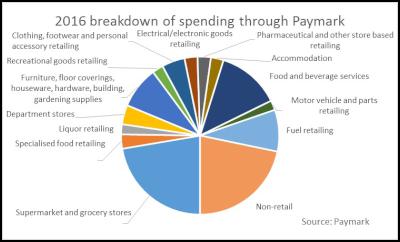
A sector breakdown of spending in 2016 shows the largest sectors to be “Supermarkets and grocery stores”, “Food and beverage services” and “Fuel retailing” amongst the retail sectors, plus there was a large proportion of transactions processed amongst non-retail merchants such as plumbers, auto repair shops, travel and tourism operators, government organisations and providers of health, telecommunication and financial services.

Figure 3: Breakdown by sector
of the value of spending through Paymark in 2016
The
fastest growing sectors in 2016, as measured by underlying
spending, were Accommodation (+18.5%), Non-retail (+14.3%)
and Food and beverage services (+14.3%), each benefitting
from strong tourism growth during the year.
Noticeably a sector with below-average growth was the “Clothing, footwear and personal accessory retailing” sector (+3.7%). This sector does face strong competition from online merchants.
Spending did decline in 2016 within the Fuel Retailing sector (-4.4%).
Looking ahead, there were a couple of cautionary notes within the Paymark seasonally adjusted monthly spending trends.
The downward fuel spending trend did reverse in the last four months of 2016, implying lower than otherwise discretionary budget for other items.
And spending within the housing-related “Furniture, floor coverings, houseware, hardware, building, gardening supplies” sector declined slightly in both the third and fourth quarters – a trend to watch in 2017.
ENDS
Paymark is New Zealand’s
leading electronic payments company
For the past 26 years we have served hundreds of thousands of New Zealand merchants through our safe, secure and reliable infrastructure.
Paymark covers more than 100,000 terminals, accounting for in excess of 75% of the New Zealand payments landscape. We process around 60 transactions every second of the day.
Paymark completed its 15 billionth transaction in October 2015.


 NZ Trucking Association: TruckSafe New Zealand Launches | A Game-Changer For Heavy Vehicle Safety And Compliance
 Gaurav Mittal, IMI: How Can We Balance AI’s Potential And Ethical Challenges?
 Science Media Centre: Several US-based Environmental Science Databases To Be Taken Down – Expert Reaction
 Consumer NZ: Despite Low Confidence In Government Efforts, People Want Urgent Action To Lower Grocery Bills
 NZ Banking Association: Banks Step Up Customer Scam Protections And Compensation
 The Reserve Bank of New Zealand: CoFR Seeking Feedback On Access To Basic Transaction Accounts


