 Scoop has an Ethical Paywall


Christmas shaping up to be a winner for retail
Christmas shaping up to be a winner for retail
16 December, 2016
A total of $2642 million was spent through the Paymark network in the first 14 days of December. This represents an underlying 6.1% increase on last year, once large merchants additions and removals from the network in the interim period are excluded.
Faster growth was experienced over the second seven days of the month (+6.7%) than the first seven days (+5.4%).
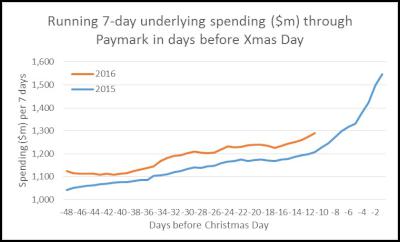
Figure 1: Underlying spending through Paymark for rolling 7 day periods
Annual growth rates for the first 14 days were strongest in Hawke’s Bay and West Coast. Spending growth was lowest in Gisborne and Marlborough region (that includes Kaikoura in Paymark’s coding), both due to exceptional circumstances.
PAYMARK All Cards Data (2016 versus
same dates 2015)
| 8-14th December | 1-14th December | |||
|---|---|---|---|---|
| Value | Underlying* | Value | Underlying* | |
| Region | transactions $millions | Annual % change | transactions $millions | Annual % change |
| Auckland/Northland | $556.4 | 6.1% | $1,090.2 | 6.0% |
| Waikato | $96.7 | 8.8% | $189.5 | 8.2% |
| BOP | $89.8 | 9.9% | $174.6 | 9.5% |
| Gisborne | $10.4 | -3.8% | $20.9 | -1.2% |
| Taranaki | $26.8 | 8.3% | $51.7 | 5.8% |
| Hawke's Bay | $38.3 | 12.5% | $74.2 | 10.4% |
| Wanganui | $12.2 | 8.6% | $23.8 | 7.5% |
| Palmerston North | $43.4 | 10.4% | $84.3 | 9.3% |
| Wairarapa | $11.6 | 8.8% | $22.5 | 7.5% |
| Wellington | $127.1 | 3.7% | $250.2 | 5.3% |
| Nelson | $26.8 | 7.4% | $51.3 | 5.1% |
| Marlborough | $15.1 | 1.9% | $29.1 | 1.2% |
| West Coast | $8.3 | 12.6% | $16.4 | 10.2% |
| Canterbury | $150.3 | 4.9% | $292.2 | 2.7% |
| South Canterbury | $21.6 | 7.9% | $41.8 | 4.6% |
| Otago | $73.4 | 10.2% | $143.2 | 8.5% |
| Southland | $30.0 | 7.5% | $58.4 | 5.8% |
| New Zealand | $1,352.9 | 6.7% | $2,642.6 | 6.1% |
* Underlying spending excludes large clients moving to or from Paymark within last 12 months
Figure 2: Paymark All Cards data (Spending to 14th December 2016 versus same dates in December 2015)
The majority (52%) of spending remains through debit cards although the growth rate is faster through credit cards, which today also includes contactless cards.
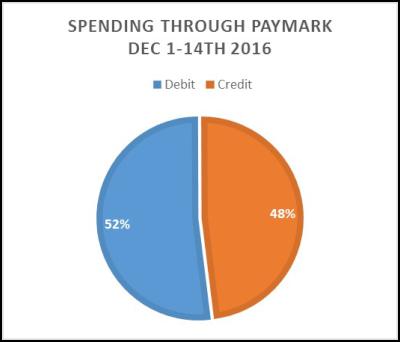
Figure 3: Paymark Debit and Credit Cards breakdown (Spending to 14th December 2016)
| Spending through Paymark ($millions) | |||
| Dec 1-14th 2015 | Dec 1-14th 2016 | Underlying annual change (%) | |
| Debit | $1,272 | $1,340 | 2.0% |
| Credit | $1,180 | $1,303 | 10.3% |
| Total | $2,451 | $2,643 | 6.1% |
Figure 4: Paymark Debit and Credit Cards data (Spending to 14th December 2016 versus same dates in December 2015)
As an insight into the pre-Christmas spending patterns, the spending rises through the day from 6-7am to reach a peak between noon and 1pm most days and then gradually tapers off. The busiest hour of the last week was noon to 1pm Friday 9 December when 484,135 transactions occurred in the hour.
The noticeable exceptions to the daily pattern is Friday night, Saturday morning and again Saturday night, Sunday morning when the hospitality sector is busy.
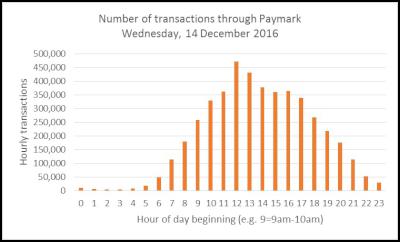
Figure 5: Paymark All Cards data for Hospitality industry (7 days ending in 2016 versus same dates in 2015)
ENDS
 The Reserve Bank of New Zealand: RBNZ Supports Release Of Police’s National Risk Assessment
 Bill Bennett: Download Weekly - ComCom Recommends Removing Rural Copper Regulations
 Hugh Grant: Why Pay Equity Software Is Essential For A Strong Employee Value Proposition
 Electricity Authority: Electricity Authority Acts Quickly To Strengthen Security Of Electricity Supply Ahead Of Winter
 School Lunch Collective: Compass Group New Zealand To Acquire Libelle Group Securing Healthy School Lunch Programme
 PSA: PPPs Pose Risks To New Zealand Workers


