 Scoop has an Ethical Paywall


Superannuitants experience highest inflation
Superannuitants experience highest inflation – Media release
8 November 2016
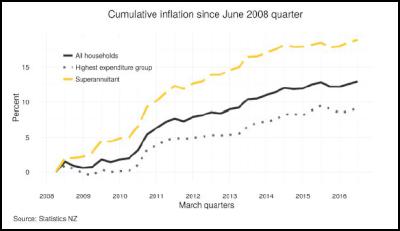
Superannuitants experienced the highest inflation over the past eight years or so, Statistics NZ said today. Their overall costs increased 19 percent when looking at their typical spending patterns. This was more than double the rate of inflation experienced by New Zealand's highest spenders (up 9.1 percent).
The inflation figures come from Statistics NZ's new data series – the household living-costs price indexes (HLPIs). These look at the inflation experienced by 13 different groups, including beneficiaries, Māori, superannuitants, and 10 other groups of people who have varying income and spending patterns.
"Superannuitants typically spent more than other groups, relative to their income, on rapidly rising costs for expenses such as insurance, local council rates, and energy bills," consumer prices manager Matt Haigh said.
Home-ownership rates are high for superannuitants (about 88 percent own). Most have paid their mortgage (less than 12 percent are homeowners with a mortgage) so their experience of inflation is largely unaffected by changes in mortgage-interest rates.
In comparison, the average weekly earnings used to index super payments increased 27 percent over the last eight years or so.
Overall, price changes for cigarettes and tobacco, rent, and household energy were greater than the general increase in prices over the period. Household groups that spent more on these goods and services experienced these price increases to a greater extent.
Interest costs actually fell over the past eight
years as the Reserve Bank dropped the official cash rate.
This meant that household groups spending a
greater-than-average proportion on interest
experienced
this decrease more.
People in the highest-spending group saw prices in the basket of goods they typically buy rise just 9.1 percent. In part this reflected a big fall in mortgage-interest rates – 83 percent of households in this group were homeowners.
Inflation for Māori households rose (up 13 percent) at almost exactly the same rate as for the average household over the last eight years or so.
For the lowest-spending group (lowest expenditure quintile), prices in their basket rose 18 percent over the eight years to the September 2016 quarter.
Difference between the HLPIs and the CPI
"We're often told that CPI does not reflect people's own experience of inflation. These new series should be more meaningful to individual households as they reflect the typical expenditure patterns of different groups in our society," Mr Haigh said.
The HLPIs are
different from the overall 'basket' of inflation that the
consumers price index (CPI) measures. The CPI measures price
changes that New Zealand households overall experience. The
CPI is a national average, so it does not reflect price
changes seen by different groups in society. The
HLPIs
also include mortgage-interest payments in place of
the construction of newly built
houses.
Ends
For more information about these statistics:
• Visit Household Living-costs Price Indexes:
September 2016 quarter
• Open the attached
files
HouseholdLivingCostsPriceIndexesSep16qtr.pdf
 Parrot Analytics: A Very Parrot Analytics Christmas, 2024 Edition
 Financial Markets Authority: Individual Pleads Guilty To Insider Trading Charges
 Great Journeys New Zealand: Travel Down Memory Lane With The Return Of The Southerner
 WorkSafe NZ: Overhead Power Lines Spark Safety Call
 Transpower: Transpower Seeks Feedback On Electricity Investment Short-list For Upper South Island
 Commerce Commission: “Cheating The System” – Sentencing In Country’s First Criminal Cartel Case


