 Scoop has an Ethical Paywall


Decline in new mortgage registrations shows market slow-down
31st October 2016
EMBARGOED UNTIL 5:30am 31st OCTOBER
Sharp decline in new mortgage registrations further evidence of property market slow-down
New figures released by myvalocity for September show the number of new residential mortgage registrations has declined nationally by 21% on the same time last year – further reinforcing the view the market is beginning to soften.
Regionally, Auckland saw the largest reduction in the number of new mortgage registrations – down 26.2% on the same time last year. The North Island’s metro centres were also down 15.6% compared to September 2015.
Wellington and the South Island metro centers buck the downward trend with growth in the number of mortgages of 2.8% on the same time last year. [refer graph2]
myvalocity CEO Carmen Vicelich says whilst there is already signs over recent months from the company’s median property sales and volume data that the market is pulling back, mortgage registrations provide another reliable metric to gauge the state of the market.
“Mortgage registrations are a good indicator of the financial performance of the market as it tracks the behavior of all active buyers rather than just what is actually selling at the time.
The sharp decline in mortgage registrations is one of the most interesting trends we have seen for a while as despite good migration, record low interest rates and the price pressure that still exists in the property market, the number of mortgage registrations has consistently declined in recent months.
This is something we have not seen before. The property market is, to some extent, seasonal and traditionally we expect to see a rise in mortgage registrations in Spring, however this has not been the case so far this year.”
Myvalocity data shows mortgage registrations peaked in October 2015 and then saw a dramatic decline between December 2015 and March 2016. Whilst it recovered slightly, the last few months has seen the gap on last year’s registrations widen to its largest yet. [refer graph1]
Mrs Vicelich says the trend indicates the Reserve Bank’s additional LVR restrictions coupled with an ongoing lack of supply are having an impact.
“Our data shows the number of active investors in the market has declined in recent months at a higher rate than any other buyer type - particularly in Auckland. The number of active investors in the market is down 19% nationally on the same time last year which indicates the brakes are starting to come on the market,” she says.
“The decline in the number of mortgage registrations is also a reflection of the current lack of stock or supply which is lower than the same time last year. Less homes for sale means less people moving and requiring new mortgages.”
myvalocity data for September 2016 shows the current market forces at play are having the biggest impact in Auckland. Investors in Auckland were down 35.3% on the same time last year. Most other buyer sectors declined in September – including refinance/switchers (those moving lending providers) which declined by 11.3% on the previous month.
Mrs Vicelich says Auckland’s first home buyers were the only sector that saw growth in September – up 4% on the previous month – indicating first home buyers may be finding it easier to buy lower priced homes in the region given there are now less buyers in the market.
Myvalocity data for September shows the number of sales for all property value bands are also below the same period last year - particularly properties valued under $500,000 which has declined significantly in the last three months.
“This is partially due to a lack of available properties for sale in this price bracket. Sales of properties under $500,000 equated to just over half (55.1%) of all homes sold nationwide in the last quarter. This is slightly above the proportion of stock available nationwide (46.2%) valued under $500,000,” says Mrs Vicelich.
In Auckland, properties over $1 million accounted for 30.3% of all sales in the last quarter which is below the proportion (41.2%) of stock valued in that price bracket in Auckland, with the majority of sales sitting in the $500,000 to $1million value band.
“What this means is as the skew of sales is sitting in the middle as opposed to the top tier or bottom tier, the current median sale price is likely quite reflective of the actual market. As opposed to when we’ve seen a high volume at the top end which further pulls any figures up,” says Mrs Vicelich.
Despite a slow down in property sales, the building sector remains buoyant with new building consents and renovations across the country significantly ahead of the same period last year.
For more Data Insights – please see the myvalocity monthly report attached.
myvalocity__NZ_Property_Report_October.pdf
Ends
Graph
1: Total NZ mortgage registrations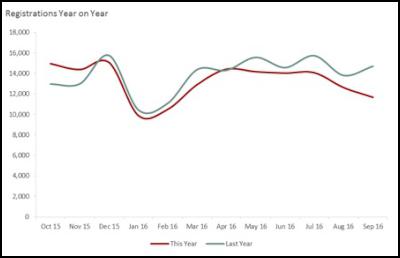
Graph 2: Regional
mortgage registration breakdown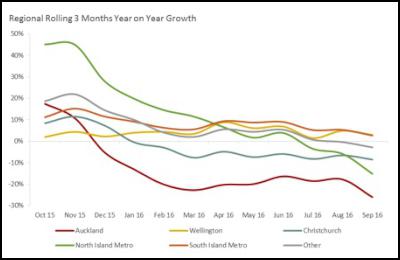
About myvalocity
myvalocity empowers kiwis with property insights so consumers can make well informed property decisions. It makes our lives easier through visually easy to understand reports and free insights. myvalocty is powered by Valocity which is New Zealand’s first locally built digital property valuation platform, with the most comprehensive and relevant range of property information. Valocity, which is one of only two automated valuation models used every day by major banks to support lending decisions. Consumers also now have access to this powerful data and accurate estimated valuation reports through myvalocity.
 Tātaki Auckland Unlimited: Iconic Auckland Eats 2025 Top 100 Dishes Revealed After Record Number Of Nominations
 Hugh Grant: What Is Cloud Migration And How Does It Work
 Property Council New Zealand: Hiwa Recreation Centre Takes Top Award At 2025 Property Industry Awards
 Great Journeys New Zealand: Scenic Plus Winter Menu Launched
 Tourism New Zealand: Tourism New Zealand Invites The World To Find Their 100% Pure New Zealand In New Global Campaign
 Bill Bennett: Comcom warns 2degrees over satellite marketing