 Scoop has an Ethical Paywall


Regions power on as the Auckland market draws breath
NEWS RELEASE 13 October 2016
Regions power on as the Auckland market draws breath
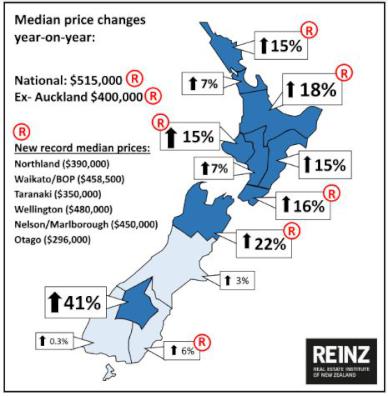
New record national median house price of $515k, and $400k median outside Auckland for the first time
At a time when the Auckland housing market appears to be taking a wet winter breather, the national median price has risen to a new record of $515,000, prices outside Auckland have hit a record median high of $400,000 and six regions of New Zealand have hit new record high median sale prices, according to data released by REINZ for September 2016.
According to the latest figures released today by REINZ, source of the most recent, complete and accurate real estate data in New Zealand, new record median sale prices were seen in Northland ($390,000), Waikato/Bay of Plenty ($458,500), Taranaki ($350,000), Wellington ($480,000), Nelson/Marlborough ($450,000) and Otago ($296,000).
At the same time, Auckland’s median price has risen 7% year-on-year to $825,000, although it dipped 2% on August 2016 on a seasonably adjusted basis. The number of sales nationwide for September 2016 was 7,397, a fall of 2% on August. Sales volumes also fell 10% compared to September 2015, with sales for Auckland falling 23% compared to September last year. On a seasonally adjusted basis, Auckland sales in September fell 3%.
KEY DATA
SUMMARY:
| National median house price year-on-year | National National ex-Auckland | $515,000 - up from $484,650 +6.3%
year-on-year $400,000 - up from $365,000 +9.6% year-on-year |
| Auckland median price | Auckland | $825,000 - up from $771,000 +7.0% year-on-year |
| Seasonally adjusted median house price | National Auckland | Up 3% on
August 2016 and up 7% year-on-year Down 2% on August 2016 and up 7% year-on-year |
| Month-on-month median house price | National National ex-Auckland Auckland | $515,000 – up 4.7% on
August: $492,000 $400,000 - up 3% on July: $387,250 $825,000 – down 2% on August: $842,000 |
| Median days to sell | National Auckland | 31 –
steady year-on-year 33 – down four days year-on-year |
| Other changes of note: inventory | Inventory continues to rapidly fall across the country, with a 20% decline in properties available for sale year-on-year and five regions with less than 12 weeks of supply, representing almost 38% of sales volumes. Wellington has seven weeks of supply available, with Otago under 10 weeks supply, Hawke’s Bay with 10 weeks supply and Waikato/Bay of Plenty and Nelson/Marlborough with 11 weeks supply. |
Real Estate Institute of New Zealand (REINZ) spokesperson Bryan Thomson says: “The real estate market in New Zealand appears to be in something of a two-speed mode at present, with Auckland pausing for breath during a wet school holiday period and ahead of likely new Spring growth. We are also seeing anecdotal evidence that first home buyers in Auckland are now favouring new builds as a way of getting finance in the light of the new LVR restrictions and the ‘carve out’ for new home construction. Meanwhile, across the rest of the country prices continue to rise, still demonstrating strong price and volume growth.”
Sales volumes declining
Across New Zealand the total value of residential sales, including sections, was $4.894 billion in September, compared to $5.182 billion in September 2015 and $4.841 billion in August. For the 12 months ended September 2016 the total value of residential sales was $58.199 billion.
There were 7,397 unconditional residential sales in September, a 10% decrease on September 2015 and a 2% decrease on August. On a seasonally adjusted basis, the number of sales fell 2% from August to September.
Median prices jump, led by the regions
The national median house price rose $30,350 (+6%) to $515,000 from September 2015 to September 2016. Compared to August the national median house price rose $23,000 (+4.7%). Central Otago Lakes recorded the largest percentage increase in median price compared to September 2015, at 41%, followed by Nelson/Marlborough at 22% and Waikato/Bay of Plenty at 18%.
Auction sales down
There were 1,769 dwellings sold by auction nationally in September, representing 24% of all sales and a decrease of 541 (-23%) on the number of auctions in September 2015.
Auckland auction transactions dropped 13% to 56% of national auction sales, compared to a year ago, reflecting reduced inventory levels. The number of auctions in Wellington increased 235% compared to September 2015, albeit off a small base, and fell by 4% across the rest of New Zealand.
Pressure on stock grows, inventory and days to sell falls
The number of properties available for sale across all regions in New Zealand except Auckland has continued to fall between September 2015 and September 2016. Wellington has the fewest properties for sale with seven weeks of supply, closely followed by Otago with under 10 weeks supply, Hawke’s Bay with 10 weeks of supply, and Waikato/Bay of Plenty and Nelson/Marlborough with 11 weeks of supply. Auckland saw an uptick in the level of inventory from 10 to 12.5 weeks of supply.
The number of days to sell has been steady at 31 days compared to September 2015, although the regions have seen some significant improvements with six regions seeing a decrease of 20% or more in the number of days to sell. Auckland and Canterbury/Westland were the only regions to see a lengthening of the number of days to sell over the past 12 months.
Million dollar homes show largest increase in volumes
| September 2016 | September 2015 | |||
| $1 million plus | 1,016 | 13.7% | 1,042 | 12.7% |
| $600,000 to $999,999 | 1,987 | 26.9% | 1,970 | 24.1% |
| $400,000 to $599,999 | 1,822 | 24.6% | 2,009 | 24.6% |
| Under $400,000 | 2,572 | 34.8% | 3,153 | 38.6% |
| All Properties Sold | 7,397 | 100.0% | 8,174 | 100.0% |
For
further data, tables and charts on prices, volumes,
inventory, days to sell, auctions – and regional
commentary and tables – please see the accompanying
report.
REINZ_Regional_Commentary__September_2016.pdf
REINZ_Residential_Data_Tables__September_2016.pdf
- ENDS -
Note:
The monthly REINZ residential sales reports remain the most recent, complete and accurate statistics on house prices and sales in New Zealand. They are based on actual sales reported by real estate agents. These sales are taken as of the date that a transaction becomes unconditional, up to 5:00pm on the last business day of the month. Other surveys of the residential property market are based on information from Territorial Authorities regarding settlement and the receipt of documents by the relevant Territorial Authority from a solicitor. As such, this information involves a lag of four to six weeks before the sale is recorded.
*Seasonal adjustment is a statistical technique that attempts to measure and remove the influences of predictable seasonal patterns to reveal how the market changes over time.
 NZAS: New Zealand Association Of Scientists Awards Celebrate The Achievements Of Scientists And Our Science System
 Stats NZ: Retail Spending Flat In The September 2024 Quarter
 Antarctica New Zealand: International Team Launch Second Attempt To Drill Deep For Antarctic Climate Clues
 Vegetables New Zealand: Asparagus Season In Full Flight: Get It While You Still Can
  Bill Bennett: Download Weekly - How would NZ telecoms cope with another cyclone
 NZ On Air: Firm Audience Favourites Lead NZ On Air Non-Fiction Funding


