Spring shoots appear in the property market
Media Release
13 September 2016
Spring shoots appear in the property market
The average asking price for a Kiwi home is on the rise again, up $6,000 over the last month to a new record of $597,250 according to the latest Trade Me Property Price Index.
Head of Trade Me Property Nigel Jeffries said the housing market had warmed up in the three months to August. “The sluggish property market we’ve seen recently is starting to gain some traction again as we shift into spring. The average asking price across New Zealand has reached a new peak of almost $600,000, a significant milestone in what has been an electrifying couple of years for the housing market.”
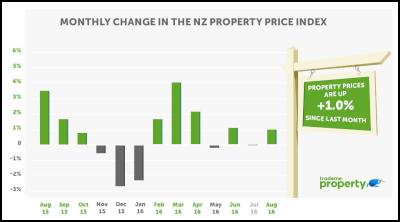
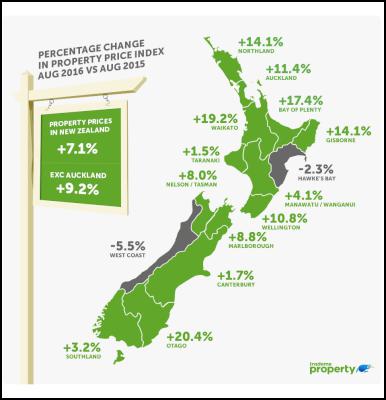
The average asking price for a typical New Zealand property was up 7.1 per cent on a year ago, and up 1 per cent since July.
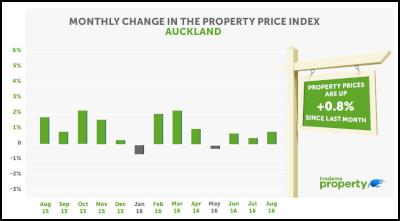
The spring resurgence saw Auckland sellers’ asking prices push up $7,000 over the month to a new high of $858,900.
“The City of Sails saw figures up over 11 per cent compared to August last year, an annual increase of $88,000. It’s we’ll below the record rise that we observed a year ago when it was up an eye-popping $130,000,” Mr Jeffries said.
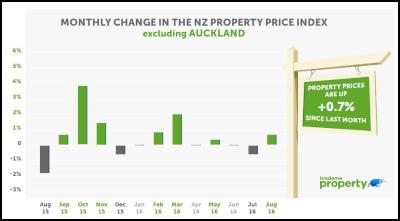
Excluding Auckland, the national average asking price rose 0.7 per cent in the month, and was up 9.2 per cent over the past 12 months to a new record high of $444,350.
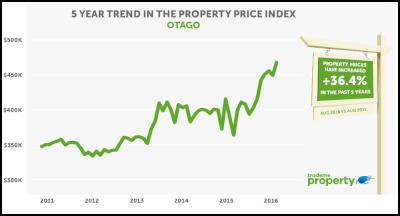
Mr Jeffries said the Otago region was “rising from its slumber” as average asking prices accelerate. “Otago has hovered around the $400,000 mark and drifted sideways from mid-2013 right through to the end of last year. But in just the space of eight months the average asking price has risen over $70,000 to top $470,000 in August, a year-on-year boost of 20 per cent.”
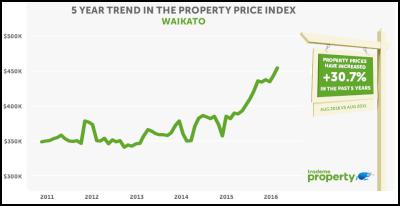
Waikato, Bay of Plenty and Northland continued to see double-digit annual growth in average asking price, all reaching record levels. Waikato rose 19.2 per cent or $73,450 to $455,050. The region was surpassed by Bay of Plenty, up 17.4 per cent or $81,300 to $549,300. Meanwhile, Northland was up 14.1 per cent or $54,750 to $442,600.
Around the regions
Only two regions showed negative shifts in average asking prices this month, with Hawke’s Bay and the West Coast seeing a fall in annual figures, down 2.3 and 5.5 per cent respectively.
“Our last Property Price Index in July saw three regions in negative territory – Taranaki, West Coast and Canterbury. While average asking prices on the West Coast remain subdued, the other two on that list have shown small annual increases in August,” Mr Jeffries said.
Seven regions showed double-digit growth, led by Otago, Waikato and Bay of Plenty.
Big ticket homes on the rise
The average asking price for large houses (5+ bedrooms) continues to accelerate faster than the overall market.
“Large homes saw a rise in average asking price of 13 per cent on last year, to a new record of $1.08m. This is an additional $127,100 over the past year, a hefty increase of more than $10,000 per month,” Mr Jeffries said.
Large houses in Auckland saw a lift in average asking price of 3.2 per cent or $40,000 to $1,335,750, while Wellington posted a sizeable one-month increase of $51,850, lifting the average asking price to $795,600.
“The market for large houses in the capital city is more volatile, as supply is far less consistent. We saw prices peak around $800,000 earlier this year,” he said.
Table 1: Average asking price by
property size & region, August 2016 vs August
2015
| All Properties | Large houses
5+ bedroom | Medium
houses 3-4 bedroom | Small
houses 1-2 bedroom | |
| New Zealand | $597,250 + 7.1% | $1,080,000 + 13.3% | $602,100 + 7.9% | $393,100 + 5.6% |
| New
Zealand excluding Auckland | $444,350 + 9.2% | $702,200 + 13.9% | $462,900 + 9.6% | $306,700 + 10.4% |
| Auckland | $858,900 + 11.4% | $1,335,750 + 15.4% | $883,000 + 12.6% | $654,300 + 6.2% |
| Wellington | $469,100 + 10.8% | $795,600 + 22.6% | $489,500 + 10.0% | $354,550 + 15.7% |
| Christchurch | $465,600 + 2.0% | $748,400 - 6.6% | $497,200 + 2.0% | $334,950 + 2.9% |
Apartments vs. houses in the City of Sails
Mr Jeffries said Aucklanders are becoming more comfortable with the idea of swapping the house in the suburbs for an urban apartment.
“We’re seeing first-time buyers face the dilemma of whether to buy an apartment or a small house. That’s a challenging prospect when you consider 1-2 bedroom houses had an average asking price of $654,300 in August, while 1-2 bedroom apartments were 14 per cent cheaper at $565,150,” he said.
Mr Jeffries said Trade Me Property had more apartments than small houses listed for sale. “Typically, there are around 225 new listings for 1-2 bedroom houses in Auckland each month, compared to 360 similar-sized apartments in the city. Interestingly, the premium for a 1-2 bedroom apartment has diminished in recent years. Two years ago the average asking price for a small apartment was almost 50 per cent lower than for a small house.”
Apartments with a price tag under $500,000 offered a greater selection compared to similar-sized houses, with four times as many for sale, but Mr Jeffries said prospective buyers should be careful to do their homework.
“If you’re thinking of purchasing an apartment over a house, it’s important to bear in mind the legal and financial complexities above and beyond purchasing other types of property. Along with the possibility of leasehold ownership, body corporate structure and other associated costs can be more complex to get your head around,” he said. “Even before the advent of the loan-to-value ratio, banks have generally been reluctant to lend unless buyers have a minimum deposit of 20 per cent.”
Table 2: Average asking price by property type & region, August 2016 vs August 2015
| All Urban Properties | Apartments | Townhouse | Units | |
| New Zealand | $509,650 + 2.3% | $538,900 + 0.7% | $557,000 + 0.8% | $441,200 + 4.9% |
| New
Zealand excluding Auckland | $377,550 + 8.2% | $459,700 + 6.2% | $413,900 + 4.9% | $306,350 + 11.4% |
| Auckland | $627,650 + 6.6% | $565,150 - 0.2% | $829,550 + 16.1% | $594,150 + 10.0% |
| Wellington | $389,350 + 10.6% | $438,750 + 15.7% | $432,150 + 5.8% | $286,500 + 6.2% |
| Christchurch | $396,500 + 4.2% | $460,400 + 16.0% | $443,550 + 3.9% | $320,100 + 1.0% |
-ends-
MORE INFORMATION
About the Trade Me Property Price Index:
The Trade Me Property Price Index measures trends in the expectations of selling prices for residential property listings added to Trade Me Property by real estate agents and private sellers over the past three months.
It provides buyers, sellers and realtors with insights into ‘for sale’ price trends by property type and property size.
The Index is produced from data on properties listed on Trade Me Property in the three months leading up to the last day of each period. Each period’s value is a truncated mean of the complete three months’ worth of listings. This is to better reflect trends in property prices rather than month-to-month fluctuations in housing stock.
The Index uses an “80% truncated mean” of the expected sale price to calculate the average asking price. This excludes the upper and lower 10% of listings by price, and averages the expected sale prices of the remaining properties.
It provides an insight into ‘for sale’ price trends by type and size of property. Other reports aggregate property price data across these various properties.


 Vegetables New Zealand: Asparagus Season In Full Flight: Get It While You Still Can
  Bill Bennett: Download Weekly - How would NZ telecoms cope with another cyclone
 NZ On Air: Firm Audience Favourites Lead NZ On Air Non-Fiction Funding
 Insurance and Financial Services Ombudsman: Woman Gets $40k More After Disputing Insurer’s Decision
 BNZ: A Quarter Of Older NZers Fear Going Online Due To Scam Concerns
 University of Auckland: Scientists Develop Tool To Monitor Coastal Erosion In Fine Detail


