What impact do milk solids payouts have on the economy?
What impact do milk solids payouts have on the economy?
Auckland, 1 May 2016
Milk solids payouts have been in the news a lot of late with a rollercoaster ride of pricing that has shaken the farming sector’s confidence.
But what
impact do these fluctuating prices have on the broader
economy?
In the May year 2013/14, Fonterra paid its milk suppliers $8.40/kg for milk solids (excluding the dividend for shareholders). That is $1.3 million for the average dairy herd at the time of 413 cows producing 153,012 kg of milk solids.
Last season the Fonterra milk solids payout was $4.40 and this season the payout is currently set at $3.90/kg. That is a drop of $0.6 million and $0.1 million in each year for the average herd. Across nearly 12,000 herds, these drops in revenue amount to around $7 billion and $1 billion respectively.
The 2013/14 and the 2015/16 payouts are extremes in recent years and revenue will also be affected by dividends and production but it is clear that multi-billion lower revenue is feeding through to huge spending reductions.

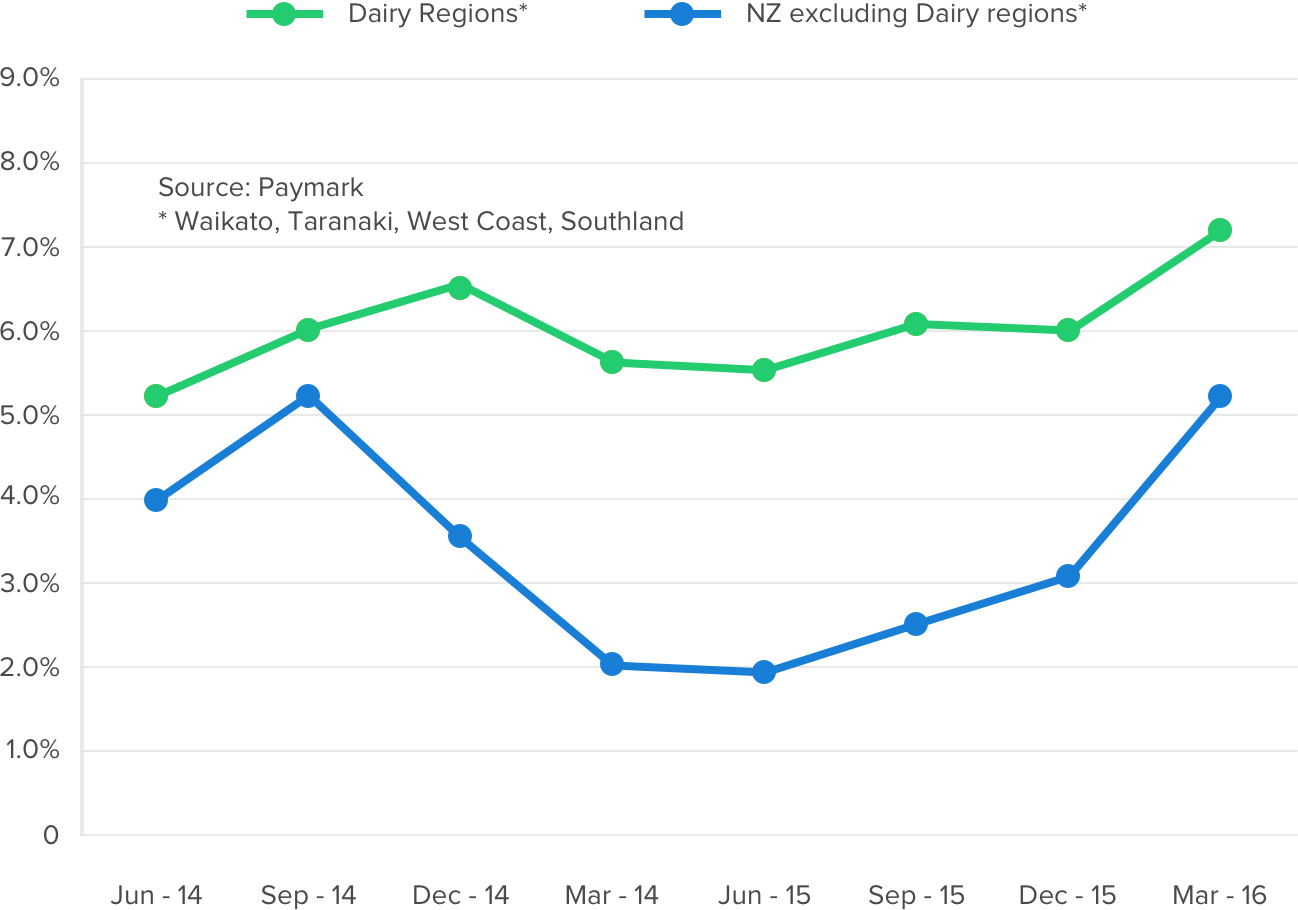
Paymark figures show some insight into the spending decline. The four most concentrated dairy regions (Waikato, Taranaki, West Coast and Southland) have experienced slower annual growth rates in recent quarters.
For the March quarter 2016, the annual underlying spending growth rate in Waikato, Taranaki, West Coast and Southland at 6.2% was 2.1% below the average in the rest of the country of 8.2%. The growth gap between these four regions and the rest of the country widened late 2014.

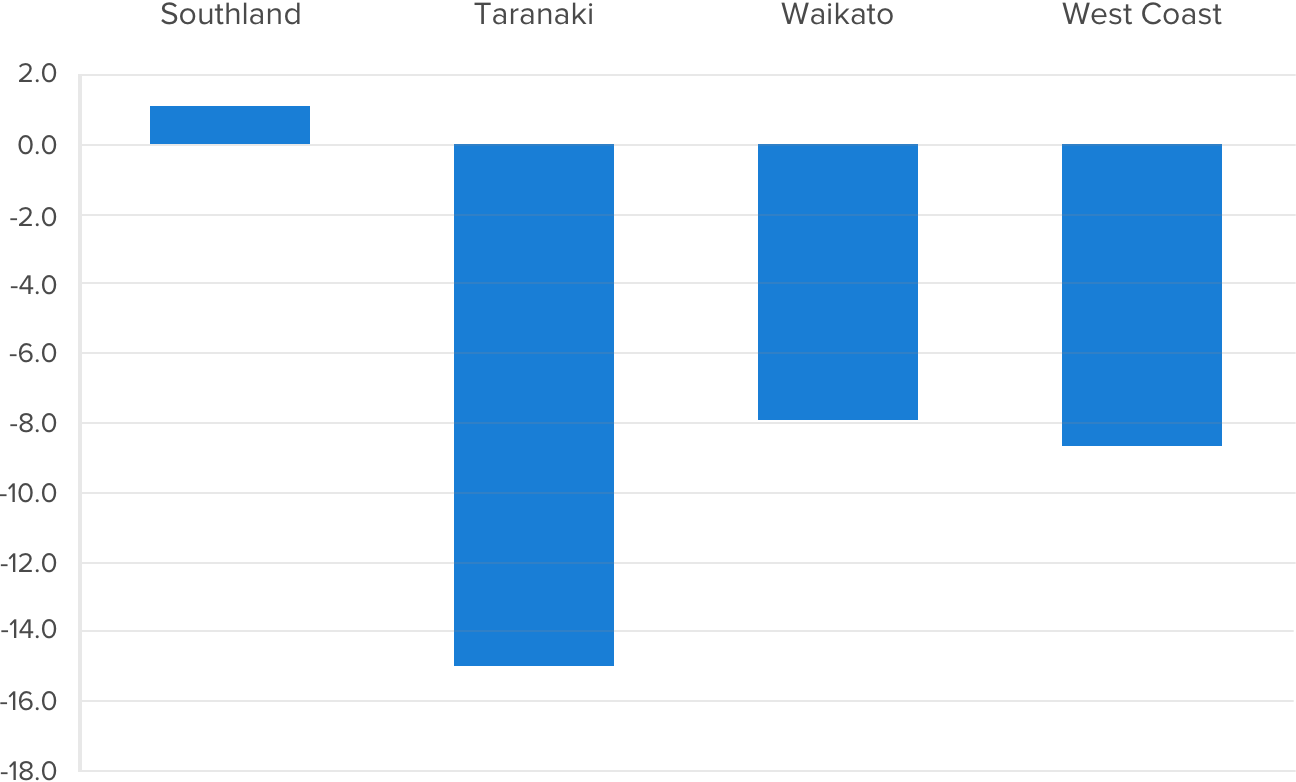
The 2.1% lower annual growth rate in the March quarter across the four dairy regions provides a crude measure of the dairy sector effect on spending. The implied spending shortfall is $31.3 million. That is, spending would have been $31.3 million higher in these four regions if the growth rate had been equivalent to that averaged elsewhere.
Over the 12 months ended March, the annual shortfall in the concentrated dairy regions was $194 million or a 3.2% lower annual growth rate than averaged in other regions.

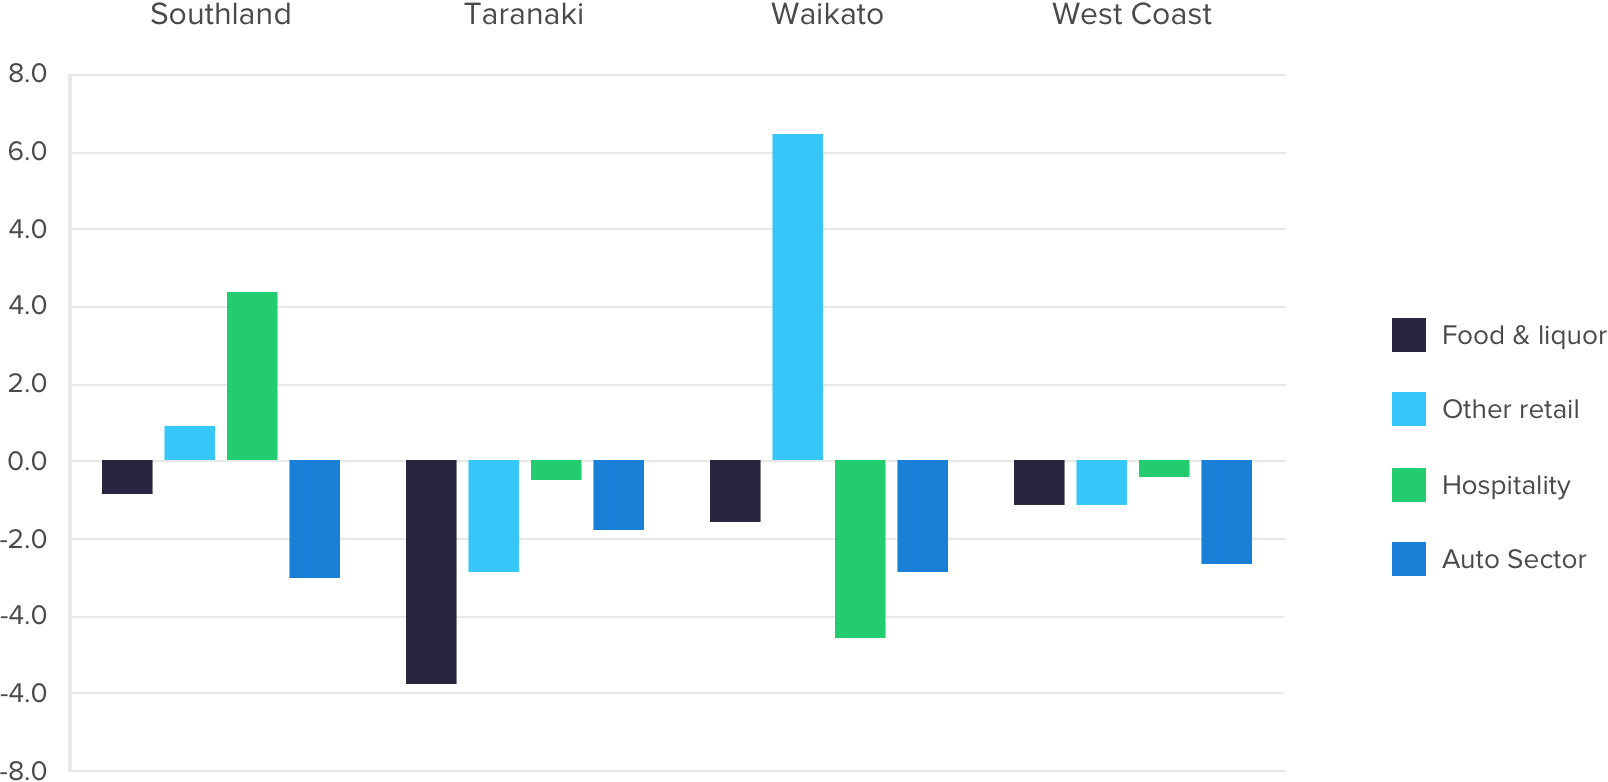
The implied spending shortfall is spread over many sectors. There was a drop in spending amongst automotive merchants (including service stations) in all four regions in contrast to a small rise in other regions. That is, the auto sectors in all regions were affected by the falling fuel price (see fuel article – add link) but the spending effect was even greater in the four dairy regions.
There was also a lower rise than elsewhere in spending on food and liquor, most notably in Taranaki.
Hospitality spending growth was lower than average in three regions, but above average in Southland, which includes Te Anau and Milford Sound, suggesting tourism is providing a counter balance. The number of guest nights in Southland accommodation was up by 19.1% and 16.7% for January and February versus the previous year, which lends weight to the assumption.
General retail spending was also lower than average in Taranaki and on the West Coast, however both Southland and Waikato regions rose faster than the average rate. Southland’s growth was likely due to the implied tourism impact but, in Waikato, strong spending growth amongst housing-related merchants suggest the strong housing market on the fringes of Auckland provided the local counter-balance.
Clearly, the lower payouts are having an effect but other sectors of the economy appear to be acting as a buffer, so the flow on impact on non-dairy businesses is less pronounced.
Paymark figures show the value of underlying transactions through their network were 11.0% higher in April relative to twelve months earlier. The underlying annual growth rate had been 11.0% and 7.1% in February and March respectively.
In seasonally adjusted terms, underlying spending through Paymark increased 2.4% between March and April 2016.
“The fall of Easter has inflated the growth rates reported for April 2016. Trading days were lost in the major centres in April 2015 and March 2016 due to holidays. Spending relative to both months will appear strong as any adjustments made by Paymark will not fully capture these holiday effects” says Paymark CMO Tim McFarlane.
“However the numbers are sufficiently high enough to suggest the spending momentum of recent months is continuing. And combining the last two months gives a 9.0% annual underlying growth rate - that’s higher than recorded for any single month in 2015 and points to strong spending growth at present.”
The sectors recording fastest annual growth rates in April included the widely encompassing Furniture and Hardware sector (+15.2%), the Motor vehicle and parts sector (+19.3%) and the Food and Beverages sector (+18.1%).
Annual underlying spending growth through Paymark was highest in Auckland/Northland (+13.0%) and Bay of Plenty (+12.0%), and lowest in West Coast (+2.9%) and Taranaki (+5.0%).
“The spending patterns within regions and sectors are consistent with four major forces shaping spending patterns. Lower fuel prices are translating into more spending on other goods and services, including on vehicles. Fast population growth and the accompanying rise in house prices and lending is showing as spending growth in and around Auckland and amongst merchants providing materials and goods related to housing. Low dairy prices are dampening rural demand, especially in Taranaki and West Coast. And high tourist numbers are providing an offset in some regions – for example Southland – and generally supporting demand amongst hospitality merchants”.
The full monthly report is available at the Insights page on the Paymark website:
www.paymark.co.nz
ENDS


 Imported Motor Vehicle Industry Association: EV Battery Fires Expose New Zealand Regulatory Gap
  Electricity Authority: Electricity Authority Welcomes Plan To Empower Consumers And ‘Make NZ More Electric’
 Pamu Farms: New Zealand Farm Dog Genetic Study Shows Top Five Health Risks
 EDANZ: Payments NZ Forcing The World’s Most Aggressive Removal Of EFTPOS Terminals
 Great Journeys New Zealand: Back By Popular Demand, The Southerner Returns
 New Zealand Association of Scientists: Budget 2025 Robs Researchers To Pay For Regulation


