2015 begins with subdued selling price expectations
Media Release
11 February
2015
2015 begins with subdued selling
price expectations
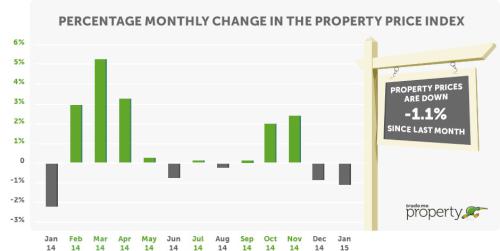
Property sellers were cautious about their selling price expectations according to Trade Me Property’s analysis of new listings in the three months ended January 2015. Asking prices slipped by 1.1 per cent between December and January, following a fall of 1 per cent a month earlier.
The average asking price across all property types for the three months to January was $498,550, slipping back below the psychological barrier of $500,000 for the first time since October 2014.
The Property Price Index measures trends in the expectations of selling prices for residential property listings added to Trade Me Property by real estate agents and private sellers over the past three months.
Head of Trade Me Property Nigel Jeffries said the easing in asking prices showed there was uncertainty around the strength of the market through the holiday period, but this was likely to only provide a temporary hiatus. “We suspect recent reports around the outlook for lower interest rates through the remainder of 2015 will see a reversal of this softness in the market over the next few months.”
Mr Jeffries said this easing in the headline level of expected selling price masked strong underlying growth over the medium and long term. “Over the past 12 months we’ve seen asking prices increase by over 14 per cent, and over the past five years the expected selling prices have risen by just under 25 per cent.”

Ups and downs in the regions
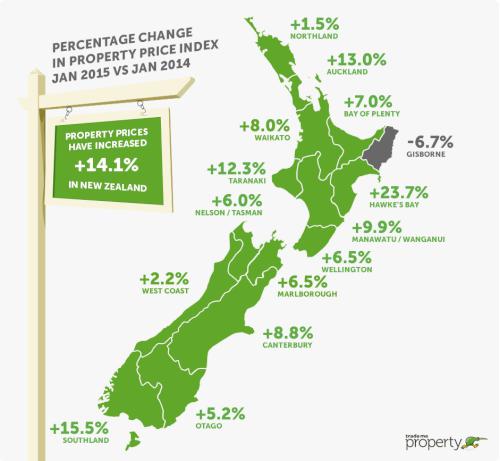
Outside the main metropolitan areas, there was strong growth in asking prices and four regions hit new record highs in asking price: Hawke’s Bay (up 23.7 per cent to a new high of $391,200 over the past year), Taranaki (up 12.3 per cent to a new high of $375,250), Bay of Plenty (up 7 per cent to a new high of $454,550), and Southland (up 5.5 per cent to a new high of $238,500).
Mr Jeffries said that since the recovery of the property market in 2011 there has been a two-speed market, but that was changing. “We’ve become accustomed to the strength of the property market in Auckland and Christchurch, with the rest of the country languishing behind. However recent months have seen this change and the majority of provincial regions are seeing strong year-on-year gains in average asking prices.”
In the year to January 2015, only Gisborne saw asking price expectations fall, down 6.7 per cent. There was low single-digit percentage growth in Northland and the West Coast, but all other regions saw growth in selling price expectation in excess of 5 per cent.
In the main metro areas, Wellington and Canterbury saw growth of 6.5 per cent and 8.8 per cent respectively, and Auckland continued to power on with price expectations up 13 per cent over the past year.

Smaller house price expectation outstrips larger properties
The trend of smaller properties (1-2 bedrooms) seeing stronger growth than the other segments of the property market continues. Over the past year, the expected selling price of smaller homes has risen by over 15 per cent from $286,000 to $330,550. In Auckland, this increase has amounted to almost $90,000 per property, landing at a new high of $552,450 in January.
Mr Jeffries said this trend reflected continuing demand from investors and first-time buyers taking advantage of the competitive marketplace for mortgages.”
By contrast the asking price trend for larger houses, especially 5+ bedroom houses continues to ease with Christchurch city seeing a fall of 16.5 per cent in the selling price expectation of these larger properties.
Table 1: Truncated mean
expected sales price by property size & region
| New Zealand | Auckland | Wellington | Christchurch | |
| Large
houses 5+ bedrooms | $842,650 + 6.4% | $1,011,750 + 3.5% | $687,350 + 3.8% | $631,450 - 16.5% |
| Medium
houses 3-4 bedrooms | $505,550 + 13.4% | $707,300 + 10.9% | $456,150 + 6.9% | $474,650 + 4.4% |
| Small
houses 1-2 bedrooms | $330,550 + 15.6% | $552,450 + 18.6% | $321,900 + 10.9% | $345,000 + 8.9% |
| All property types | $498,550 + 14.1% | $691,300 + 13.0% | $437,500 + 6.5% | $444,400 + 4.6% |
Apartment market
continues to eclipse previous highs
Mr Jeffries said the apartment market continued to reach new heights. In January, the selling price expectation for an apartment rose to $436,800, up 17 per cent increase on a year ago. In Auckland, the market remained very active, up 21 per cent year-on-year. This represented a $75,000 increase in selling expectation in the past 12 months, and the average asking price was now $439,150.
The rate of increase across the segments of townhouses and units was less significant than for apartments, but Auckland’s market for townhouses continued to rise strongly, up 11 per cent rise to a new high of $650,450.
Table 2: Truncated mean expected
sales price by property type & region
| New Zealand | Auckland | Wellington | Christchurch | |
| Apartments | $436,800 + 17.0% | $439,150 + 21.8% | $407,900 + 3.1% | $472,300 + 23.4% |
| Townhouses | $462,900 + 7.8% | $650,450 + 11.0% | $398,750 + 5.0% | $410,700 - 0.1% |
| Units | $341,800 + 12.1% | $449,450 + 7.3% | $248,000 - 2.8% | $297,850 + 11.0% |
| All property types | $498,550 + 14.1% | $691,300 + 13.0% | $437,500 + 6.5% | $444,400 + 4.6% |
-ends-
MORE
INFORMATION
About the Trade Me
Property Price Index:
o The Property Price
Index measures trends in the expectations of selling prices
for residential property listings added to Trade Me Property
by real estate agents and private sellers over the past
three months.
o It provides buyers, sellers and realtors
with insights into ‘for sale’ price trends by property
type and property size.
o The Index is produced from data
on properties listed on Trade Me Property in the three
months leading up to the last day of each period. Each
period’s value is a truncated mean of the complete three
months’ worth of listings. This is to better reflect
trends in property prices rather than month-to-month
fluctuations in housing stock.
o The Index uses an
“80% truncated mean” of the expected sale price. This
excludes the upper and lower 10% of listings by price, and
averages the expected sale prices of the remaining
properties.
o It is the first report to provide an
insight into ‘for sale’ price trends by type and size of
property. Other reports tend to aggregate the property price
data across these various
properties.


 Stats NZ: Retail Spending Flat In The September 2024 Quarter
 Antarctica New Zealand: International Team Launch Second Attempt To Drill Deep For Antarctic Climate Clues
 Vegetables New Zealand: Asparagus Season In Full Flight: Get It While You Still Can
  Bill Bennett: Download Weekly - How would NZ telecoms cope with another cyclone
 NZ On Air: Firm Audience Favourites Lead NZ On Air Non-Fiction Funding
 Insurance and Financial Services Ombudsman: Woman Gets $40k More After Disputing Insurer’s Decision


