2014 year of mixed sentiment in residential market
Media release
14 January, 2015
STRICLY EMBARGOED UNTIL 12 NOON 14 JANUARY, 2015
2014 was a year of mixed sentiment in the residential property market
It was a stop start year for residential property values with some flat periods due to uncertainty associated with the LVR speed limits, interest rate hikes and an election, along with periods of rapid value increases in some areas and decreasing values in others.
Overall the nationwide average shows residential property values increased 4.9% or $22,652 during 2014 from $466,022 in December 2013 to $488,674 in December 2014, according to the latest statistics from Quotable Value (QV) powered by CoreLogic.
The average national value increased 1.5% over the final three months of 2014 and nationwide values overall are now 17.9% higher than the previous market peak reached in late 2007.
Values in the Auckland region increased 9.8% or $68,309 from $693,549 at December 2013 to $761,858 at December 2014. They rose 4.2% over the past three months and are now 39.4% higher than the previous peak of 2007.
Sales volumes were also down on 2013 for every month despite picking up towards the end of the year however they remain at historically low levels and CoreLogic research shows there were changes in who was buying property during 2014.
QV National Spokesperson, Andrea Rush, “After a slow start to the year following the introduction of the LVR speed limits, values picked up in February and March but then following four interest rate hikes during March and July value increases plateau-ed.”
“The prospect of further interest rate rises in the lead up to the election seemed to cause some uncertainty as to whether the market had peaked and this led to a slowdown in the market during the middle of the year.”
“For Auckland and Christchurch value increases slowed while in some other centres such as Wellington, Hamilton and Dunedin saw a decrease in values during this period.”
“However, once the election was over and interest rates rises were put on hold, there was a surge of new listings and activity with the coming of spring and values began to tick upwards again in most of the main centres.”
“The return of relatively low interest rates offered by the banks with cash incentives coupled with record migration levels has since led to a strong reacceleration of values in the Auckland.”
Main Centres


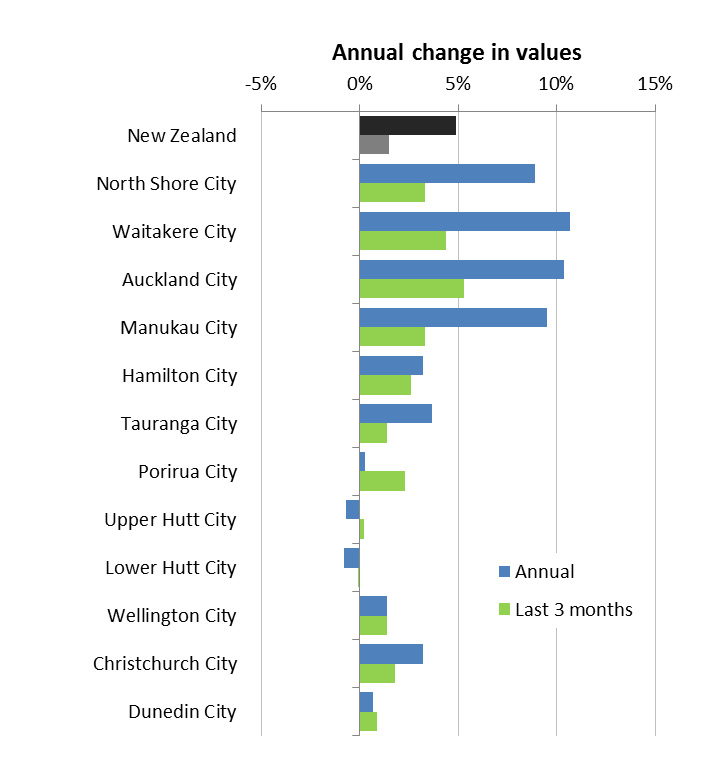
Home values in the old Auckland City area increased 10.4% year on year to December 2014 and 5.3% in the last three months of 2014 illustrating how much value increases have accelerated in the last quarter of the year.
Waitakere City homes values also were up 10.7% year on year to December and 4.4% since the beginning of October. North Shore City was also up 8.9% year on year and 3.3% in the last three months of the year.
Manukau City values increased 9.5% year on year and 3.3% since October; Papakura District values were up 10.6% year on year accelerating by 5.6% over the last three months of the year and Rodney District was up 7.0% year on year to December 2014 and 0.9% since October.
Values in Hamilton also surged ahead in the last three months of the year; up 3.2% year on year and 2.6% since October. Tauranga home values increased 3.7% year on year and 1.4% since October.
Home values in Wellington City are also showing a recent upturn increasing 1.4% year on year to December and rising 1.4% since October after showing a downward trend in the middle of the year.
Christchurch increased 3.2% year on year and 1.8% since October. Value increases in Christchurch City have slowed somewhat as the number of homes repaired increases and new homes coming onto the market is seeing supply being to keep up with demand.
Dunedin City remained steady with values increasing 0.7% year on year and 0.9% over the last three months of 2014.
Provincial Areas
Many of the provincial centres were impacted by the LVR speed limits harder than the main cities with record low listings, minimal sales activity and little value movement.
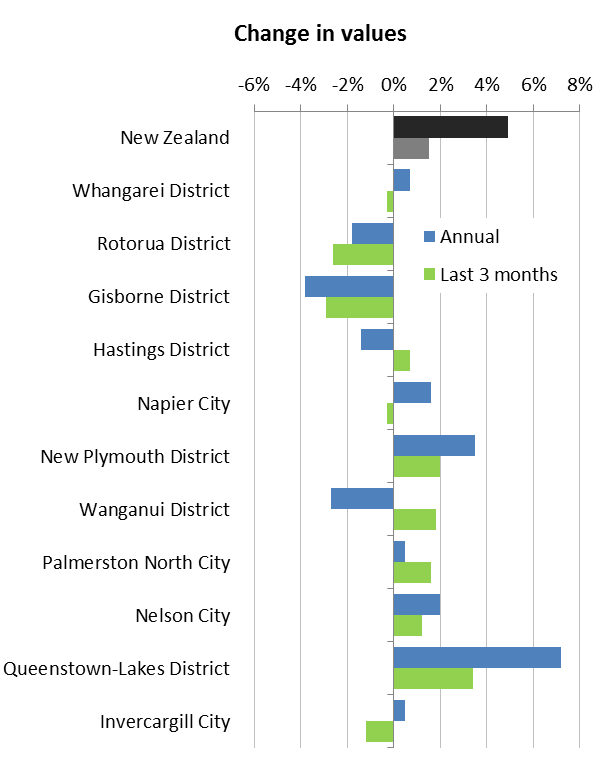
Whangarei District values increased 0.7% in 2014 while Rotorua District saw values decrease 1.8%; as did Hastings District down 1.4% in the year to December 2014 while Napier City values were up 1.6%. Nelson City values also rose 2.0% as did Invercargill City values up by 0.5% in 2014.
Satellite towns to Auckland and Christchurch as well as Queenstown Lakes District and New Plymouth saw the largest value increases while Gisborne and Wanganui saw the greatest declines in value.
Values in Franklin District increased 8.5% during 2014, while Kaipara District was up 4.0% both areas benefiting from the “Auckland effect”. Values in Timaru, Ashburton and Waimate rose 4.7%, 4.8% and 4.6% respectively which may in part due to the proximity of these towns to Christchurch. Queenstown Lakes District saw values increase 7.2% and New Plymouth District values rose 3.5%. Gisborne District values decreased 3.8% and Wanganui District was also down by 2.7% in 2014.
LVR Speed Limits and Sales Volumes
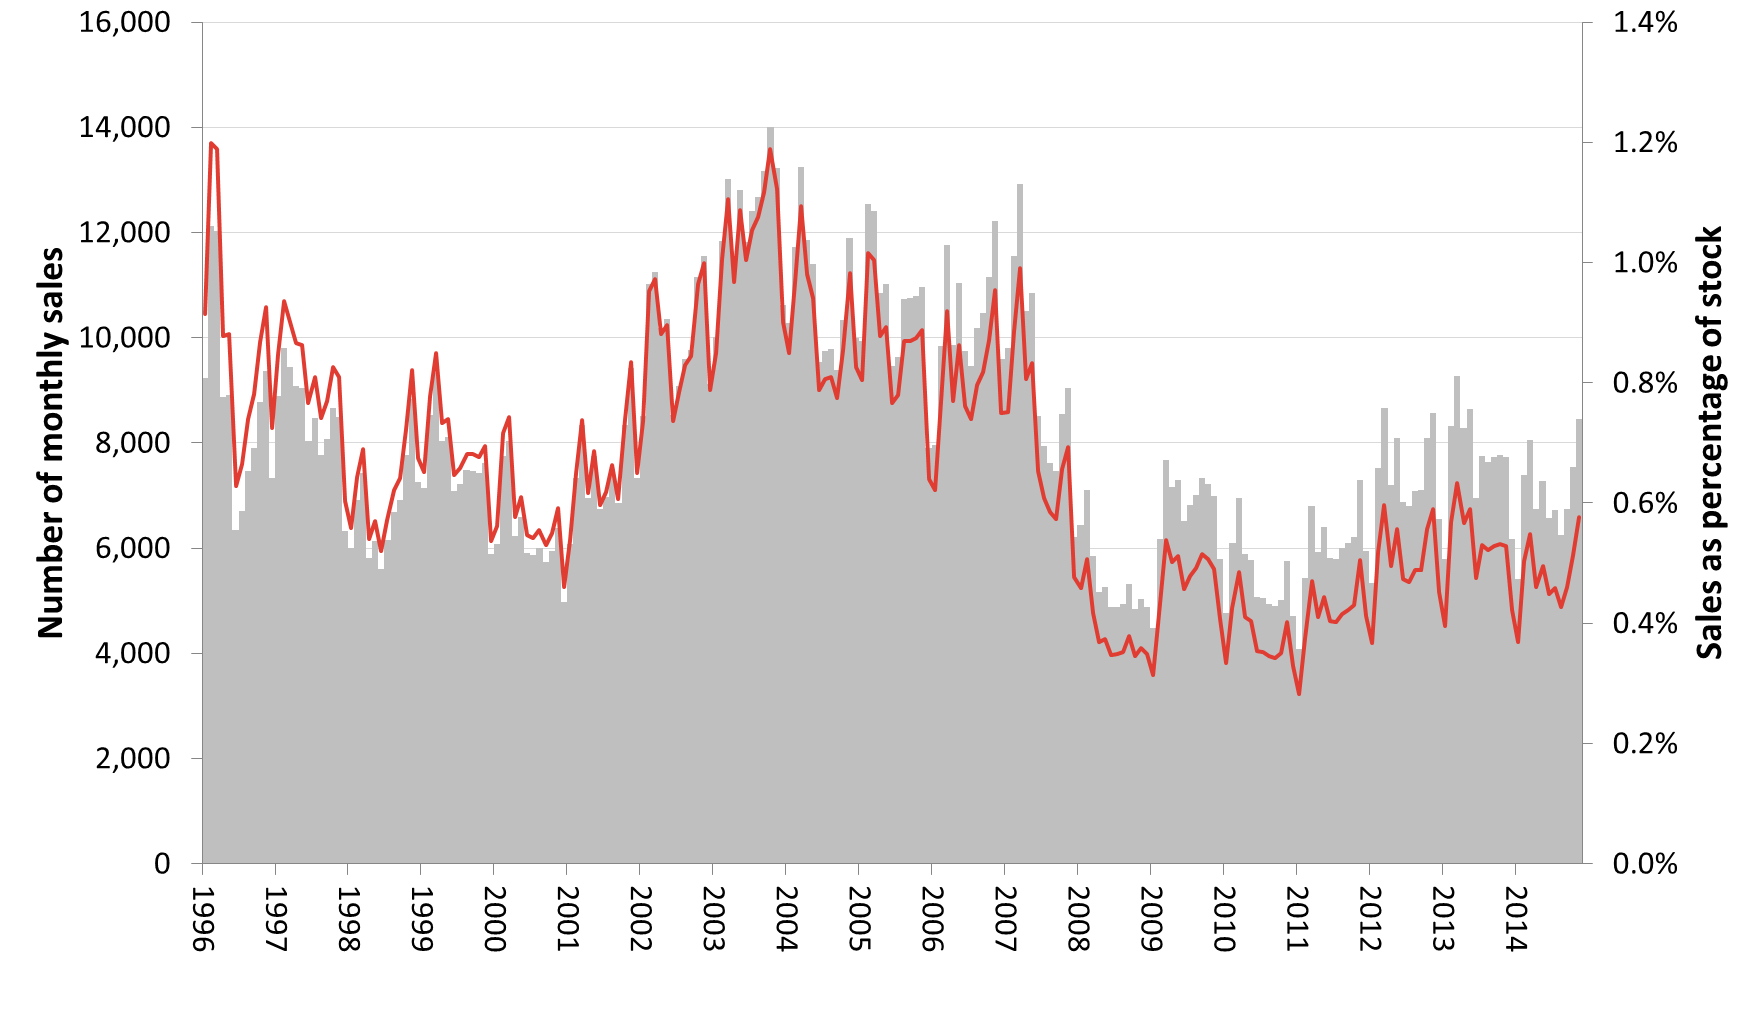
During 2014 house sales volumes continued to drop below the number seen in the same months of 2012 and 2013.
CoreLogic Director of Research, Jonno Ingerson said, “Rather than necessarily being a direct result of the LVR speed limits, this was in fact a continuation of a downward trend that had started in early 2013.”
“Looking back a little further shows that sales volumes were much higher during the 2003 to 2007 boom. Volumes then dropped dramatically in 2008 during the GFC, and have since never recovered to normal levels.”
“A useful way to compare sales historically is to represent the number of sales as a percentage of the total housing stock at the time,” he said.
“During 2014 the turnover dropped, and reached a low of 0.43% in August, and apart from the GFC this was the lowest turnover since at least the early 1980’s when our records begin,” Jonno Ingerson said.
“So despite talk of rapidly increasing values it is worth bearing in mind that sales activity was still very low.”
“Yet economic conditions are positive and consumer confidence high so the low number of sales didn’t seem sustainable. Sure enough in the last few months of 2014 turnover picked up again, but is still historically low.”

Ingerson said that one more obvious impact of the LVR speed limits is the change in the type of buyers active in the market during 2014.
Immediately following the introduction of the LVR limits the percentage of sales to first home buyers dropped from 20% to below 17%.
But this gradually recovered during the year to end at around 18%. The number of sales to people owning more than one property (mostly investors) increased during the year from 37% to 41%.
But perhaps the most obvious change was the drop in sales to people moving from one house to another. This dropped from 30% of the sales to under 25%.
This drop in movers also happened in 2008 and again in 2010 as the GFC affected consumer confidence.
“For the property market to return to a more normal mix of buyers we would need to see this mover group becoming more active again,” said Jonno Ingerson.
The outlook for 2015
Ingerson’s expectation is that sales turnover will remain buoyant in the first few months of 2015. However the lack of listings will continue to constrain the market.
“While there was a usual seasonal increase in new listings from August through to November, this dropped away in December as people waited until the New Year to list their properties,” said Jonno Ingerson.
“The increased sales activity at the end of the year outstripped this new supply meaning that total listings have once again dropped back, making it lean pickings for buyers. New listing activity typically picks up from mid-January but unless there are far more than we saw last year then supply is likely to remain less than demand.
“Given strong migration, continuing low interest rates, a shortage of housing and good consumer confidence, values are likely to keep increasing in Auckland throughout this year. There may be modest increases in some of the other main centres, but most smaller centres are likely to remain steady.”
The Reserve Bank has also stated that it is prepared to introduce further measures to slow down the market if necessary.
“Given that during the last three months of 2014 Auckland values rose faster than they did during the 2003 to 2007 boom, and some of the other main centres are also rising again, the Reserve Bank is likely to consider what action to take,” said Ingerson.
“This may include further restraints on bank lending given that interest rates are unlikely to rise until later this year.”
ENDS
QV_Residential_Price_Movement_Index_31DEC2014.xlsx


 Commerce Commission: Systemic Breaches Of Consumer Law Lead To $1.5million Fine For Kiwibank
 SolarZero: SolarZero Limited (in Liquidation) - Important Business Update
 Science Media Centre: Cyclone Gabrielle's Impacts On NZ's Ecosystems - Expert Reaction
 RNZ: Parts Of Power System Could Be Out For 36 Hours In Event Of Extreme Solar Storm
 NZAS: New Zealand Association Of Scientists Awards Celebrate The Achievements Of Scientists And Our Science System
 Stats NZ: Retail Spending Flat In The September 2024 Quarter


