 Scoop has an Ethical Paywall


Sales volumes fall with prices steady in April market
News Release 12 May 2014
Sales volumes fall with prices steady in April market
Summary
• 5,670
dwellings sold in April 2014, down 20.2% on April 2013 and
down 22.5% on March
• All regions saw declines
in sales numbers compared to March and to April
2013
• The National, Auckland and Christchurch
House Price Indices all recorded record highs in March
2014
REINZ, the most up to date source of real estate data in New Zealand, announced today that there were 5,670 dwelling sales in the month of April, down 20.2% on April last year and down 22.5% compared to March. The national median price was $432,250 for the month of April, an increase of $41,750 compared to April 2013, but a fall of $7,750 from March.
Real Estate Institute of New Zealand (REINZ) Chief Executive Helen O’Sullivan says, “The sharp fall in sales volumes in April has impacted all regions, as well as Auckland and Christchurch where much of the price pressure has been in recent times. The fall in April compared to March 2014 and April 2013 deepens the underlying trend for easing sales volumes. April is generally a softer month for real estate sales coming off the back of a generally strong March and with the added complications of school holidays and Easter. However, these factors cannot explain the entire drop between April this year and April last year – the volume of sales has retreated to 2012 levels, and is the seventh lowest April volume recorded by REINZ. ” [The volume of sales in April 2014 was the seventh lowest April sales volume in the 23 years REINZ has published sales data. April 2014 sits between the number of sales recorded in April 1993 (5,484) and April 1995 (5,932). The sales volume in April 2012 was 5,676.]
“The number of sales in the sub-$400,000 category continue to fall faster than the market overall, suggesting that the LVR restrictions are continuing to have an impact on buyer intentions at the lower price points. . The lift in the Official Cash Rate by 0.5% over the past two months is likely to have also had an effect. At the same time there is increasing activity in the $1 million plus category, not only in Auckland but in a number of other centres as well. Commentary from real estate agents around the country indicates that first home buyers are an even scarcer commodity than they were in October and November last year.”
Sales
Volumes
REINZ data shows there were 5,670
unconditional residential sales in April, a 20.2% fall on
sales recorded for April 2013, and a 22.5% fall from March.
April typically includes the Easter break and school
holidays, however on a seasonally adjusted basis the level
of sales was down almost 8% compared to March and down 18%
compared to April 2013.
All regions recorded falls in sales volume compared to March with Southland recording the largest fall of 28.7%, followed by Auckland with 27.2%. Compared to April 2013 all regions recorded a fall in sales volume with Manawatu/Wanganui recording the largest fall of 29.4%, followed by Otago with a fall of 24.3% and Taranaki with a fall of 24.0%.
While the total number of sales was down 20.2% compared to April 2013, the number of sales below $400,000 fell by 31.6%. This follows a fall in sales below $400,000 of 21.9% between March 2013 and March 2014. This may be indicative of fewer sales in the lower price brackets since the imposition of the LVR restrictions.
Prices
The national median
house price fell by $7,750 (-1.8%), from $440,000 in March,
to $432,250 in April. Compared to April 2013 the national
median house price increased by $41,750 (+10.7%), with eight
regions recording an increase in the median price. 70% of
the increase in the national median price compared to April
last year occurred in Auckland, with Canterbury/Westland
contributing 15% of the increase and Waikato/Bay of Plenty
contributing 13%. Together these three regions accounted for
88% of the increase in the median price between April 2013
and April 2014.
Northland recorded the largest increase in median price compared to April 2013, with a 16.8% increase, followed by Canterbury/Westland with an 11.9% increase and Waikato/Bay of Plenty with a 10.5% increase. Compared to March, Northland also recorded the largest increase in median price, up 12.5%, followed by Southland with 8% and Taranaki with 6.9%.
The REINZ Stratified Housing Price Index, which adjusts for some of the variations in the mix that can impact on the median price, is 8.5% higher than April 2013, at a new record of 3971.2. The Auckland Index has risen 15.2% compared to April 2013, with the Christchurch Index up 13.6% and the Wellington Index up 1.0%.
Days To Sell
Dwellings took one day fewer to sell in
April compared to March at 34 days. Compared to April 2013,
the median number of days to sell was steady at 34 days.
Four regions saw an improvement in the number of days to
sell between April 2013 and April 2014, with Central Otago
Lakes recording the largest improvement of 10 days.
Auckland saw its number of days to sell remain steady at 30
days.
For the month of April, Canterbury/Westland recorded the shortest days to sell at 28 days, followed by Auckland at 30 days and Wellington at 34 days. Northland recorded the longest number of days to sell at 65 days, followed by Hawkes Bay with 54 days and Taranaki with 48 days. Over the past 10 years the median days to sell for the month of April has averaged 36 days across New Zealand.
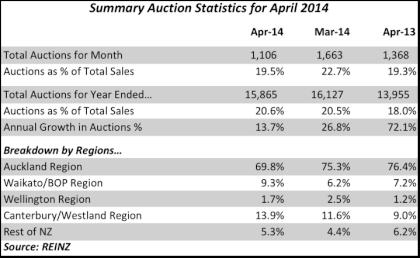
Auctions
Nationally
there were 1,106 dwellings sold by auction in April
representing 19.5% of all sales and a reduction of 262 on
the number of dwellings sold by auction in April 2013. For
the 12 months to April 2014 the total number of sales by
auction reached 15,865 or 20.6% of all sales, compared to
13,955 or 18.0% of all sales for the 12 months to April
2013.
Transactions in Auckland again dominated the auction market in April representing 69.8% of the national total of auction sales. 34.9% of all dwelling sales in Auckland were by auction in April, compared to 37.3% of sales by auction in April 2013. Sales by auction in Waikato/Bay Of Plenty accounted for 9.3% of the national total, Canterbury/Westland accounted for 13.9% of the national total, and all other regions combined accounted for the remaining 5.3% of auction sales in April 2014.
Further Data
Across New Zealand the total value of
residential sales, including sections was $3.09 billion in
April, compared to $4.07 billion in March, and $3.50 billion
in April 2013. For the 12 months ended April the total
value of residential sales was $39.78 billion.
The
breakdown of the value of properties sold in April 2014
compared to April 2013 is:
| April 2014 | April 2013 | |||
| $1 million plus | 431 | 7.6% | 377 | 5.3% |
| $600,000 to $999,999 | 1,185 | 20.9% | 1,263 | 17.8% |
| $400,000 to $599,999 | 1,557 | 27.5% | 1,816 | 25.6% |
| Under $400,000 | 2,497 | 44.0% | 3,648 | 51.4% |
| All Properties Sold | 5,670 | 100.0% | 7,104 | 100.0% |
There were 1,151 fewer (-31.6%) sales under $400,000 in April 2014 compared to April 2013, compared to a drop of 1,434 sales (-20.2%) for all price brackets between the two periods.
REINZ Stratified Median Housing Price
Index
The REINZ Housing Price Index rose
0.1% compared with March to sit at 3,971.2. Auckland rose
2.0% in April to reach a new record high, Christchurch rose
4.4% to also reach a new record high, and Wellington rose
3.8%. For the 12 months to April, the Auckland Index rose
15.2%, the Christchurch Index rose 13.6% and the Wellington
Index rose 1.0%. The National Index increased 8.5% compared
to April last year.
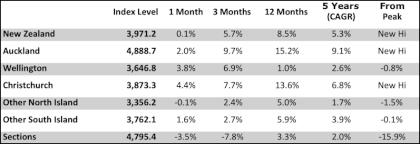
* CAGR is Compound Annual Growth
Rate
* The Christchurch data needs to be treated
with some caution due to compositional changes in the suburb
mix caused by the earthquakes in the city
----- ENDS -----
REINZ_Residential_Property_Market_Report__April_2014.pdf
REINZ__Regional_Data_April_2014.pdf
For more real estate information and market trends data, visit www.reinz.co.nz. For New Zealand's most comprehensive range of listings for residential, lifestyle, rural, commercial, investment and rental properties, visit www.realestate.co.nz - REINZ's official property directory website.
Editor’s
Note:
The monthly REINZ residential sales
reports remain the most contemporary and up-to-date
statistics on house prices and sales in New Zealand. They
are based on actual sales reported by real estate agents.
These sales are taken as of the date that a transaction
becomes unconditional and includes sales as of 5:00pm on the
last business day of the month. Other surveys of the
residential property market are based on information from
Territorial Authorities regarding settlement and the receipt
of documents by the relevant Territorial Authority from a
solicitor. As such, this information involves a lag of four
to six weeks before the sale is recorded by the Territorial
Authority.
The REINZ Monthly Housing Price Index
is calculated using a technique known as stratification,
which provides an averaging of sales prices for common
groups of houses. This approach is considered a more robust
analysis of actual house price trends and was developed in
conjunction with the Reserve Bank.
The REINZ
Monthly Housing Price Index is based on a value of 1000 in
January 1992, the first month for which electronic
information is available. Changes in the index represent
movements in housing prices, where the mix of sales between
the groups is held constant and are more likely to reflect
genuine property price
movements.
 NZAS: New Zealand Association Of Scientists Awards Celebrate The Achievements Of Scientists And Our Science System
 Stats NZ: Retail Spending Flat In The September 2024 Quarter
 Antarctica New Zealand: International Team Launch Second Attempt To Drill Deep For Antarctic Climate Clues
 Vegetables New Zealand: Asparagus Season In Full Flight: Get It While You Still Can
  Bill Bennett: Download Weekly - How would NZ telecoms cope with another cyclone
 NZ On Air: Firm Audience Favourites Lead NZ On Air Non-Fiction Funding


