Media release
ASB Cantometer Index
Embargoed until 5am Thursday 27 February
ASB Cantometer hits new high
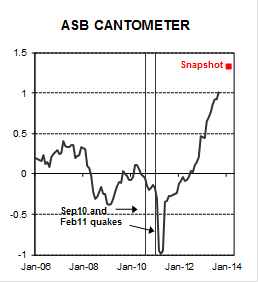
• The ASB Cantometer hit a new high of 1.3 in February.
• Q4 employment data showed strong job gains.
• Prospects bright for 2014.
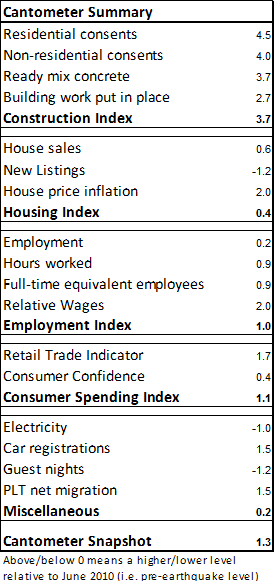
The ASB Cantometer index rose to a new high of 1.3 in February, up from 1.1 in January, buoyed by a range of activity indicators that continue to strengthen.
“This is a significant leap for the Cantometer from last month, aided by the labour market data release at the end of 2013 showing a very strong increase in the number of people in work in the region,” says ASB Chief Economist Nick Tuffley.
Mr Tuffley also points to a rebound in building consent issuance.
“In January the Cantometer index had dipped to 1.1, mainly due to very weak non-residential building consent issuance data for November. At the time, we cautioned that the softness was likely to be temporary, and that has indeed been the case. December’s data showed the strongest issuance since the earthquakes.”
“Residential consent issuance also had its strongest month since the earthquakes,” says Mr Tuffley. “Stronger consent issuance confirms that rebuilding activity will accelerate further over 2014.”
Outlook
The
strong overall level of the Cantometer index suggests that
the outlook for 2014 is very bright. “The rebuild is still
in the early stages, and while it will be more protracted
than originally envisioned, the pace of activity will
accelerate rapidly over the next year or two,” concludes
Mr Tuffley.


About the Cantometer
The Cantometer is designed to summarise activity in Canterbury. The study takes a range of publically available regional economic data, which are standardised and aggregated into a summary measure. The index has been rebased to zero in June 2010 (the end of the quarter immediately preceding the first earthquake) such that a positive number represents activity being above pre-earthquake levels.
Along with the aggregate Cantometer index, there are five sub categories: Construction, Housing, Employment, Consumer spending and Miscellaneous*.
These sub-indices will provide some insight into which sectors are driving the rebuild activity at a given point in time.
For most activity the data reference the level of activity. However, when incorporating wages and house prices into the index we believe levels are less informative. Instead the index uses prices relative to the rest of the country.
An increase in relative prices is a signal for resources to be reallocated to the Canterbury region.
The historical Cantometer series represented on the charts is a simple average of the complete set of data for each month.
*The miscellaneous category includes electricity, car registrations, guest nights and permanent and long-term net migration. A common factor driving these areas will be population growth, and we expect all these indicators to increase as the rebuild gathers momentum.
If you would like to receive ASB updates and reports by email: https://reports.asb.co.nz/register/index.html
ENDS


 Antarctica New Zealand: International Team Launch Second Attempt To Drill Deep For Antarctic Climate Clues
 Vegetables New Zealand: Asparagus Season In Full Flight: Get It While You Still Can
  Bill Bennett: Download Weekly - How would NZ telecoms cope with another cyclone
 NZ On Air: Firm Audience Favourites Lead NZ On Air Non-Fiction Funding
 Insurance and Financial Services Ombudsman: Woman Gets $40k More After Disputing Insurer’s Decision
 BNZ: A Quarter Of Older NZers Fear Going Online Due To Scam Concerns


