 Scoop has an Ethical Paywall


Softer Prices and Volumes in January Market
14 February 2014
Softer Prices and Volumes in January Market
Summary
• 4,719 dwellings
sold in January 2014, down 4.3% on January
2013
• National median price eased $25,000 to
$402,000 (-5.8%) from record high set in
December
• Nelson/Marlborough reached a new high
median price
• More than 1 in 5 sales were by
auction in the 12 months to January 2014
REINZ, the most up to date source of real estate data in New Zealand, announced today that there were 4,719 dwelling sales in the month of January, down 4.3% on January last year and down 17.0% compared to December. The national median price of $402,000 was an increase of $32,000 or 8.6% compared to January 2013, and a decrease of $25,000 from December 2013. Nelson / Marlborough reached a new high median price of $380,000.
Real Estate Institute of New Zealand (REINZ) Chief Executive Helen O’Sullivan says, “There are a number of factors in play in the market in January, including seasonal factors and the ongoing impact of restrictions on high loan to value lending. As a result it is difficult to get an entirely clear steer on the direction of the market this month.“
“Volumes are still strong relative to the last five years, but are down 4.3% overall on the same time last year. The softer volume result continues a pattern that began in November and continued in December; however, market feedback suggests that first homebuyers may be tentatively returning – with some assistance - to certain markets. This is by no means a consistent message, with views decidedly mixed outside of the main cities.”
“The national median price is up $32,000 or 8.6% on the same time last year, but down $25,000 or just under 6% from December 2013. This does suggest a softening price trend, which would come as a relief to many commentators. However January data is often impacted by the seasonal mix of properties, with fewer high value properties coming to market in this month. The Stratified House Price Index, which adjusts for some of the mix issues, is down by 2.2% compared with December 2013”.
“Also of interest in the month is the small but steadily increasing number of properties coming to market in Christchurch being sold on an “as is, where is” basis – that is, damaged and unrepaired. Prices achieved can range from full value for lightly damaged properties to land value less demolition costs for severely damaged dwellings. We will be taking a close interest in this trend as it develops.”
Sales Volumes
REINZ data
shows there were 4,719 unconditional residential sales in
January, a 4.3% fall on January 2013, and a fall of 17.0%
from December. A fall from December volumes is to be
expected given that many campaigns will be timed to start in
the latter half of the month after the holiday season ends,
and transactions therefore don’t conclude in that calendar
month. On a seasonally adjusted basis the number of sales
was 1.1% lower compared to December, indicating that the
number of sales in January was lower than would normally be
expected for this time of the year.
Four regions recorded increases in sales volume compared to January last year, with Central Otago Lakes recording the largest increase of 39.8%, followed by Northland with 11.9% and Hawkes Bay with 8.6%. Four regions recorded an increase in sales volume compared to December, with Manawatu/Wanganui recording the largest increase of 20.1%, followed by Taranaki with an increase of 6.1% and Central Otago Lakes with an increase of 5.5%.
While the total number of sales was down 4.3% compared to January 2013, the number of sales below $400,000 fell by 15.6%. This follows a fall in sales below $400,000 of 16.8% between December 2012 and December 2013. This may be indicative of fewer sales in the lower price brackets since the imposition of the LVR restrictions.
Prices
The national median
house price fell $25,000 (-5.9%), from $427,000 in December,
to $402,000 in January. Compared to January 2013 the
national median house price increased by $32,000 (+8.6%),
with 10 regions recording an increase in the median price.
69% of the increase in the national median price compared to
January last year occurred in Auckland and 13% occurred in
Waikato/Bay of Plenty. Christchurch contributed 10% of the
increase in median price over that period. Together these
three regions accounted for 92% of the increase in the
median price between January 2014 and January
2013.
Nelson/Marlborough recorded a new median high in January of $380,000. Auckland’s median price however softened, down $31,000 from December 2013. Compared to January 2013 Nelson/Marlborough recorded the largest increase in median price, up 11.8%, followed by Auckland with 11.7% and Otago with 10.9%.
The REINZ Stratified Housing Price Index, which adjusts for some of the variations in the mix that can impact on the median price, is 7.7% higher than January 2013. The Auckland Index has risen 14.0% compared to January 2013, with the Christchurch Index up 10.0% and the Wellington Index down 1.1%.
Days To Sell
Dwellings took 11 days
more to sell in January compared to December at 43 days.
Compared to January 2013, the median number of days to sell
was two days longer. Four regions saw an improvement in the
number of days to sell between January 2013 and January
2014, with Wellington recording the largest improvement of
eight days. Waikato/Bay of Plenty saw an improvement of
seven days and Taranaki saw an improvement of five
days.
For the month of January, Canterbury/Westland recorded the shortest days to sell at 35 days, followed by Auckland at 38 days, and Wellington at 42 days. Northland and Hawkes Bay recorded the longest number of days to sell at 61 days, followed by Waikato/Bay of Plenty and Manawatu/Wanganui with 53 days. Over the past 10 years the median days to sell for the month of January has averaged 45 days across New Zealand.
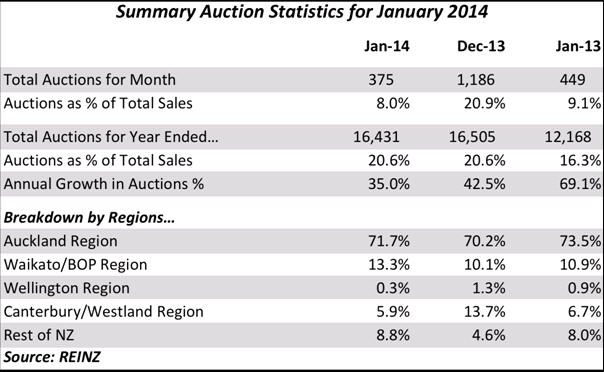
Auctions
Nationally there were
375 dwellings sold by auction in January representing 8.0%
of all sales and a reduction of 74 on the number of
dwellings sold by auction in January 2013. Auctions have
been increasingly favoured as a sales method in certain
centres over the past year; for the 12 months to January
2014 the total number of sales by auction reached 16,431 or
20.6% of all sales, compared to 12,168 or 16.3% of all sales
for the 12 months to January 2013.
Transactions in Auckland again dominated the auction market in January, representing 71.7% of the national total of auction sales. 15.5% of all dwelling sales in Auckland were by auction in January; down from the 18.3% of sales by auction in January 2013. Sales by auction in Waikato/Bay Of Plenty accounted for 13.3% of the national total, Canterbury/Westland accounted for 5.9% of the national total, and all other regions combined accounted for the remaining 8.8% of auction sales in January 2014.
Further Data
Across New
Zealand the total value of residential sales, including
sections was $2.33 billion in January, compared to $3.07
billion in December, and $2.24 billion in January 2013. For
the 12 months ended January the total value of residential
sales was $40.20 billion.
The breakdown of the value of properties sold in January 2014 compared to January 2013 is:
January 2014
| $1 million plus | 222 | 4.7% |
| $600,000 to $999,999 | 821 | 17.4% |
| $400,000 to $599,999 | 1,350 | 28.6% |
| Under $400,000 | 2,326 | 49.3% |
| All Properties Sold | 4,719 | 100.0% |
January
2013
| $1 million plus | 167 | 3.4% |
| $600,000 to $999,999 | 711 | 14.4% |
| $400,000 to $599,999 | 1,299 | 26.3% |
| Under $400,000 | 2,756 | 55.9% |
| All Properties Sold | 4,933 | 100.0% |
There were 430 fewer (-15.6%) sales under $400,000 in January 2014 compared to January 2013, compared to a drop of 214 sales (-4.31%) for all price brackets between the two periods.
REINZ Stratified Median Housing Price
Index
The REINZ Housing Price Index fell 2.4%
compared with December to sit at 3,756.3. Auckland fell by
2.5% in January, Christchurch fell 1.9%, and Wellington fell
by 2.0%. For the 12 months to January, the Auckland Index
rose 14.0%, the Christchurch Index rose 10.0% and the
Wellington Index fell 1.1%. The National Index increased
7.7% compared to January last year.
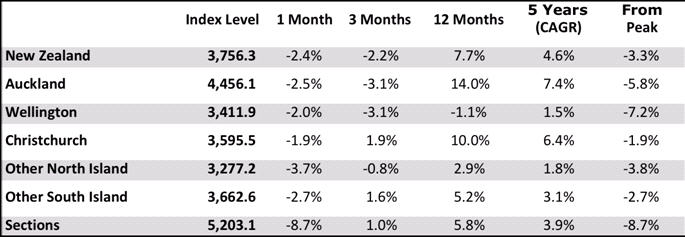
* CAGR is Compound Annual Growth
Rate
* The Christchurch data needs to be treated
with some caution due to compositional changes in the suburb
mix caused by the earthquakes in the city
For more
information:
• REINZ
Residential Market Statistics - January 2014
• REINZ
Regional Data - January 2014
For more real estate information and market trends data, visit www.reinz.co.nz. For New Zealand's most comprehensive range of listings for residential, lifestyle, rural, commercial, investment and rental properties, visit www.realestate.co.nz - REINZ's official property directory website.
The monthly REINZ residential sales reports remain the most contemporary and up-to-date statistics on house prices and sales in New Zealand. They are based on actual sales reported by real estate agents. These sales are taken as of the date that a transaction becomes unconditional and includes sales as of 5:00pm on the last business day of the month. Other surveys of the residential property market are based on information from Territorial Authorities regarding settlement and the receipt of documents by the relevant Territorial Authority from a solicitor. As such, this information involves a lag of four to six weeks before the sale is recorded by the Territorial Authority.
The REINZ Monthly Housing Price Index is calculated using a technique known as stratification, which provides an averaging of sales prices for common groups of houses. This approach is considered a more robust analysis of actual house price trends and was developed in conjunction with the Reserve Bank.
The REINZ Monthly Housing Price Index is based on a value of 1000 in January 1992, the first month for which electronic information is available. Changes in the index represent movements in housing prices, where the mix of sales between the groups is held constant and are more likely to reflect genuine property price movements.
ENDS
 Zhenbo Wang, The Conversation: From New Commercial Moon Landers To Asteroid Investigations, Expect A Slate Of Exciting Space Missions In 2025
 Worldline: Boxing Day Spending Up On Last Year, But Pre-Christmas Spending Is Slightly Down
 Skoltech: Scientists Reinvent Physical Laws Governing Formation Of Snowflakes, Raindrops, And Saturn’s Rings
 Trademe: Trash To Treasure - Kiwi Make The Most Of Unwanted Christmas Gifts
  Financial Markets Authority: FMA Seeks Clarity From High Court On Use Of Eligible Investor Certificates In Wholesale Investment Sector
 Scion: Scion’s Novel Internship Model Connects Talent With Industry


