 Scoop has an Ethical Paywall


Rural Stats: Mild Winter Leads To Early Spring
News Release 14 August 2013
Mild Winter Leads To Early
Spring
Summary
Data
released today by the Real Estate Institute of NZ
(“REINZ”) shows there were 82 more farm sales (+23.0%)
for the three months ended July 2013 than for the three
months ended July 2012. Overall, there were 438 farm sales
in the three months to end of July 2013, compared to 474
farm sales for the three months ended June 2013 (-7.6%).
1,536 farms were sold in the year to July 2013, 6.7% more
than were sold in the year to July 2012.
The median price per hectare for all farms sold in the three months to July 2013 was $20,667; a 15.1% increase on the $17,955 recorded for three months ended July 2012. The median price per hectare rose 4.8% compared to June.
The REINZ All Farm Price Index rose by 2.1% in the three months to July compared to the three months to June, from 2,892.4 to 2,953.0. Compared to July 2012 the REINZ All Farm Price Index rose by 4.6%. The REINZ All Farm Price Index adjusts for differences in farm size, location and farming type compared to the median price per hectare, which does not adjust for these factors.
Nine regions recorded increases in sales volume for the three months ended July 2013 compared to the three months ended July 2012. Waikato recorded the largest increase in sales (+25 sales), followed by Auckland (+23 sales) and Bay of Plenty (+13 sales). Four regions recorded decreases in sales volume with Wellington recording the largest fall (-7 sales), followed by Manawatu/Wanganui and West Coast (-2 sales) and Gisborne (-1 sale). Compared to the three months ended June 2013 six regions recorded an increase in sales, lead by Bay of Plenty (+10 sales).
“Ideal late winter and early spring conditions, combined with solid payout predictions for primary produce have raised levels of confidence in the rural sector”, says REINZ Rural Spokesperson Brian Peacocke, “Demand for quality farms is strong across the entire country and in most regions, early signs indicate a shortage of supply for the spring selling season.”
“Calving activity reduced sales of dairy farms in July, but sales of finishing and grazing properties have remained at healthy levels in the top half of the North Island as well as in Canterbury, Otago and Southland regions. Sales for other farm types have remained light.”
“Activity has remained strong in Southland for all farm types, with particular demand for properties with soils that are capable of sustainable wintering. There is strong interest in grazing properties, particularly dairy and dairy support properties in Otago. The proposed irrigation schemes in Canterbury and Hawkes Bay are also generating interest in those regions.”
Grazing properties accounted for the largest number of sales with 44.1% share of all sales over the three months to July, Dairy properties accounted for 10.7%, Finishing properties accounted for 24.9% and Horticulture properties accounted for 8.9% of all sales. These four property types accounted for 88.6% of all sales during the three months ended July 2013.
Dairy Farms
For the three
months ended July 2013 the median sales price per hectare
for dairy farms was $34,882 (47 properties), compared to
$29,555, for the three months ended June (66 properties),
and $22,679 (29 properties) for the three months ended July
2012. The median dairy farm size for the three months ended
July 2013 was 147 hectares.
Included in sales for the month of June were 10 dairy farms at a median sale value of $35,713 per hectare. The median farm size was 149 hectares with a range of 64 hectares in Waikato to 525 hectares in Hawkes Bay. The median production per hectare across all dairy farms sold in July 2013 was 861kgs of milk solids.
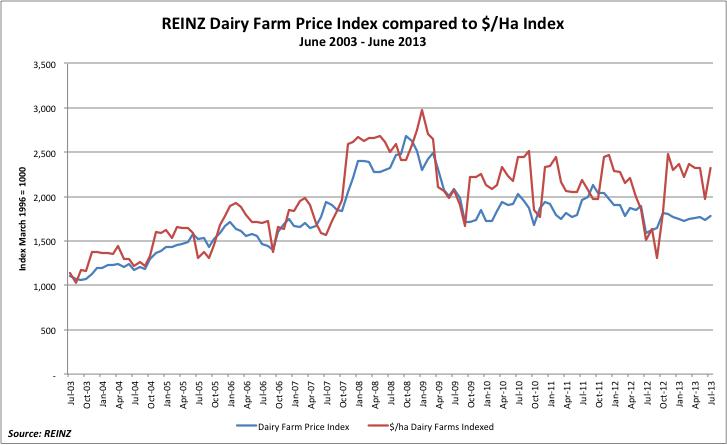
The REINZ Dairy Farm Price Index rose by 2.2% in the three months to July compared to the three months to June, from 1,738.9 to 1,777.1. Compared to July 2012 the REINZ Dairy Farm Price Index rose by 12.2%. The REINZ Dairy Farm Price Index adjusts for differences in farm size and location compared to the median price per hectare, which does not adjust for these factors.
Finishing
Farms
For the three months ended July 2013
the median sale price per hectare for finishing farms was
$22,500 (109 properties), compared to $18,672 for the three
months ended June (92 properties), and $23,028 (71
properties) for the three months ended July 2012. The
median finishing farm size for the three months ended July
2013 was 50 hectares.
Grazing Farms
For the three months ended July 2013 the
median sales price per hectare for grazing farms was $15,367
(193 properties) compared to $13,831 for the three months
ended June (228 properties), and $13,023 (190 properties)
for the three months ended July 2012. The median grazing
farm size for the three months ended July 2013 was 56
hectares.
Horticulture
Farms
For the three months ended July 2013
the median sales price per hectare for horticulture farms
was $100,667 (39 properties) compared to $120,345 (42
properties) for the three months ended June, and $130,000
(29 properties) for the three months ended July 2012. The
median horticulture farm size for the three months ended
July 2013 was six hectares.
Lifestyle
Properties
The lifestyle property market saw
a 18.2% (+276 sales) increase in sales volume in the three
months to July 2013 compared to July 2012. 1,790 sales were
recorded in the three months to July 2013 compared to 1,514
sales in the three months to July 2012. 27 more sales were
recorded compared to the three months to June 2013 (+2.0%).
For the 12 months to July 2013 there were 6,368
unconditional sales of lifestyle properties, an increase of
18.0% over the 12 months to July 2012.
12 regions recorded increases in sales compared to July 2012 while two recorded decreases in sales. Auckland recorded the largest increase (+101 sales), followed by Canterbury (+41 sales) and Otago (+25 sales). Compared to June 2013, 10 regions recorded increases in sales with three regions recording a decrease. Otago recorded the largest increase in sales (+14 sales), followed by Canterbury (+11 sales) and Waikato (+6 sales).
The national median price for lifestyle blocks rose by $13,500 (+2.8%) from $475,000 for the three months to July 2012 to $488,500 for the three months to July 2013. The median price for lifestyle blocks in Auckland rose by 16.5% in the year to July 2013, and rose by 4.4% in Waikato, however, the median price fell by 14.2% in Canterbury. Compared to June 2013 the median price fell by $16,500 (-3.3%) from $505,000 in June to $488,500 in July.
The number of days to sell for lifestyle properties eased by three days, from 69 days for the three months to the end of June to 72 days for the three months to the end of July. Compared to the three months ended July 2012 the number of days to sell improved by 13 days from 85 days to 72 days. Taranaki recorded the shortest number of days to sell in July at 28 days, followed by Southland at 46 days and Canterbury at 55 days. Gisborne recorded the longest number of days to sell at 124 days, followed by Northland and Bay of Plenty, both on 105 days.
Commenting on the lifestyle property market Brian Peacocke said, “Rising residential prices in the major cities is providing additional stimulus in the lifestyle sector with demand for lifestyle properties rising the most in rural Auckland and Canterbury. Demand in Waikato is also rising in response to higher Auckland house prices.”
“Highlights include; a surge in sales in Canterbury driven by a mix of delays in rebuilding and a shortage of listings; an active market in the Waikato in the $800,000 to $1 million range; and a consistently strong market on the Auckland urban area fringes.”
REINZ All Farm Price Index –
Additional Data
The table below sets out the
returns for the REINZ All Farm Price Index for the three
months ending July 2013.
REINZ ALL FARM PRICE
INDEX
Index level 2,953.02
1 Month 2.1%
3 Months
0.2%
1 Year 4.6%
5 Years (CAGR)* -3.4%
10 Years
(CAGR)* 6.0%
* Compound Annual Growth Rate
The graph
below shows the trends in the REINZ All Farm Price Index
compared to an index of movements in the $/hectare measure
of farm prices.

Click for big version.
REINZ
Dairy Farm Price Index – Additional
Data
The table below sets out the returns
for the REINZ Dairy Farm Price Index for the three months
ending July 2013.
REINZ DAIRY FARM PRICE INDEX
Index
level 1,777.08
1 Month 2.2%
3 Months 0.9%
1 Year
12.2%
5 Years (CAGR)* -5.3%
10 Years (CAGR)* 4.9%
*
Compound Annual Growth Rate
The graph below shows the
trends in the REINZ Dairy Farm Price Index compared to an
index of movements in the $/hectare measure of farm
prices.
Click for big version.
----- ENDS
-----
REINZ_Rural_Market_Statistics_July_2013.pdf
Real
Estate Institute of New Zealand
For more real
estate information and market trends data, visit
www.reinz.co.nz. For New Zealand's most comprehensive range
of listings for residential, lifestyle, rural, commercial,
investment and rental properties, visit
www.realestate.co.nz - REINZ's official
property directory website.
Editors
Note:
The information provided by REINZ
in relation to the rural real estate market covers the most
recently completed three month period; thus references to
July refer to the period from 1 May 2013 to 30 July
2013.
The REINZ Farm Price Indices have been
developed in conjunction with the Reserve Bank of New
Zealand. It adjusts sale prices for property specific
factors such as location, size and farm type which can
affect the median $/hectare calculations and provides a more
accurate measure of farm price movements. The REINZ Farm
Price Indices has been calculated with a base of 1,000 for
the three months ended March 1996. The REINZ Farm Price
Indices is best utilised in assessing percentage changes
over various time periods rather than trying to apply
changes in the REINZ Farm Price Index to specific property
transactions.
 Skoltech: Scientists Reinvent Physical Laws Governing Formation Of Snowflakes, Raindrops, And Saturn’s Rings
 Trademe: Trash To Treasure - Kiwi Make The Most Of Unwanted Christmas Gifts
  Financial Markets Authority: FMA Seeks Clarity From High Court On Use Of Eligible Investor Certificates In Wholesale Investment Sector
 Scion: Scion’s Novel Internship Model Connects Talent With Industry
 Financial Markets Authority: Westpac Admits To Misleading Representations That Resulted In $6.35m In Overcharges
 Bill Bennett: Download Weekly - Review Of 2024


