 Scoop has an Ethical Paywall


Sales Lift and Prices Ease In July Real Estate Market
News Release 12 August 2013
Sales Lift and Prices Ease In July Residential Real Estate Market
Summary
-6,777
houses sold in July 2013, up almost 15% on July 2012
-New median high price in Otago; Auckland and
Canterbury/Westland ease back
-National Stratified
House Price Index eases back; Auckland House Price Index up
13.9% over July 2012
-1,381 houses sold by
auction, representing over 20% of all sales in
July.
-Market continues to experience a
significant shortage of listings
House sales surged in July achieving a six year high for the July month.
REINZ, the most up to date source of real estate data in New Zealand, announced today that there were 6,777 dwelling sales in the month of July, up 14.7% on July last year and 10.5% higher than June. The national median price eased back $9,000 compared to June to $385,000, and is now $15,000 below the record median set in March 2013.
Real Estate Institute of New Zealand (REINZ) Chief Executive Helen O’Sullivan says, “It is the most active winter the residential real estate market has seen for a while, with the volume of sales higher than would normally be expected for this time of year. Reports from agents around the country suggest that first home buyers are moving quickly to secure properties ahead of any move by the Reserve Bank to impose lending restrictions on buyers with lower deposits.”
July is usually one of the quietest months in the real estate calendar with new listings and sales at low levels.
"As far as buyers are concerned the normal winter slow down hasn’t happened this year, with volumes up strongly on July last year despite school holidays occurring in the middle of month. The increase in new listings in the month contributed to buyer activity which coupled with the easing in prices suggests that the main constraint is very much one of supply. Stock levels across almost all regions are now particularly tight. ”
“The issue of housing availability remains a key for Auckland and Canterbury, but this is also now being seen in other parts of the country.”
Sales
Volumes
REINZ data shows there were 6,777
unconditional residential sales in July, a 14.7% increase on
July 2012, and an increase of 10.5% compared to June 2013.
On a seasonally adjusted basis the volume of residential
sales was up 3.9% compared to June, and up 11.1% compared to
July 2012.
Nine regions recorded increases in sales volume compared to July last year, with Waikato/Bay of Plenty recording an increase of 29.1%, followed by Northland with 23.7% and Central Otago Lakes with 19.7%. 10 regions recorded an increase in sales volume in July compared to June, with Hawkes Bay recording an increase of 40.1%, followed by Manawatu/Wanganui with an increase of 23.3% and Southland with an increase of 22.9%.
Prices
The national median
house price fell by $9,000 (-2.3%), from $394,000 in June,
to $385,000 in July. Compared to July 2012 the national
median house price increased by $24,000 (+6.6%), with all 12
regions recording an increase in the median price. 64.0% of
the increase in the national median price compared to July
last year occurred in Auckland and 9.9% occurred in
Canterbury/Westland. Together these two regions accounted
73.9% of the increase in the median price between July 2012
and July 2013.
Otago recorded a new record median price of $266,778. Compared to July 2012, Nelson/Marlborough recorded the largest increase in median price, up 14.6%, followed by Central Otago Lakes with 13.8%, and Taranaki with 13.2%.
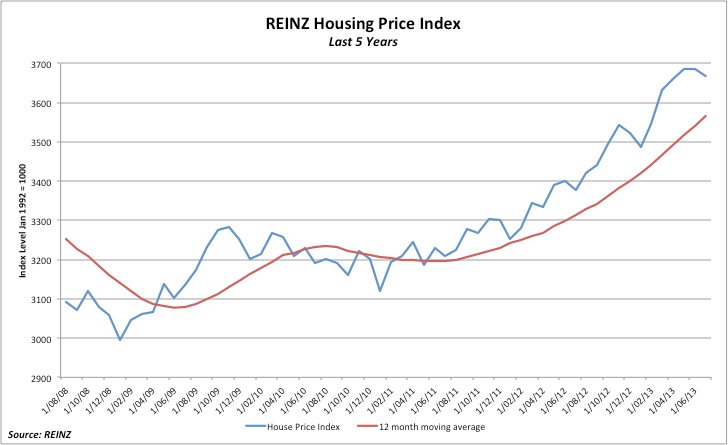
The REINZ Stratified Housing Price Index, which adjusts for some of the variations in mix that can impact on the median price, is 8.6% higher than July 2012 and eased 0.5% compared to June. The Auckland Index has risen 13.9% compared to July 2012, the Christchurch Index is up 5.4% and the Wellington Index is up 3.7% - however, the Auckland Index was down 4.4% from June 2013 while the Christchurch Index was down 4.1%.
Days To
Sell
Houses took one day longer to sell in
July compared to June, easing from 34 days in June to 35
days in July. Compared to July 2012, the number of days to
sell improved by three days. Seven regions saw an
improvement in the number of days to sell between July 2012
and July 2013, with Central Otago Lakes recording the
largest improvement of 15 days.
For the month of July, Canterbury/Westland recorded the shortest days to sell at 28 days, followed by Auckland at 29 days, and Nelson/Marlborough at 42 days. Northland recorded the longest number of days to sell at 66 days, followed by Central Otago Lakes with 61 days and Southland with 60 days. Over the past 10 years the median days to sell for the month of July has averaged 38 days across New Zealand.
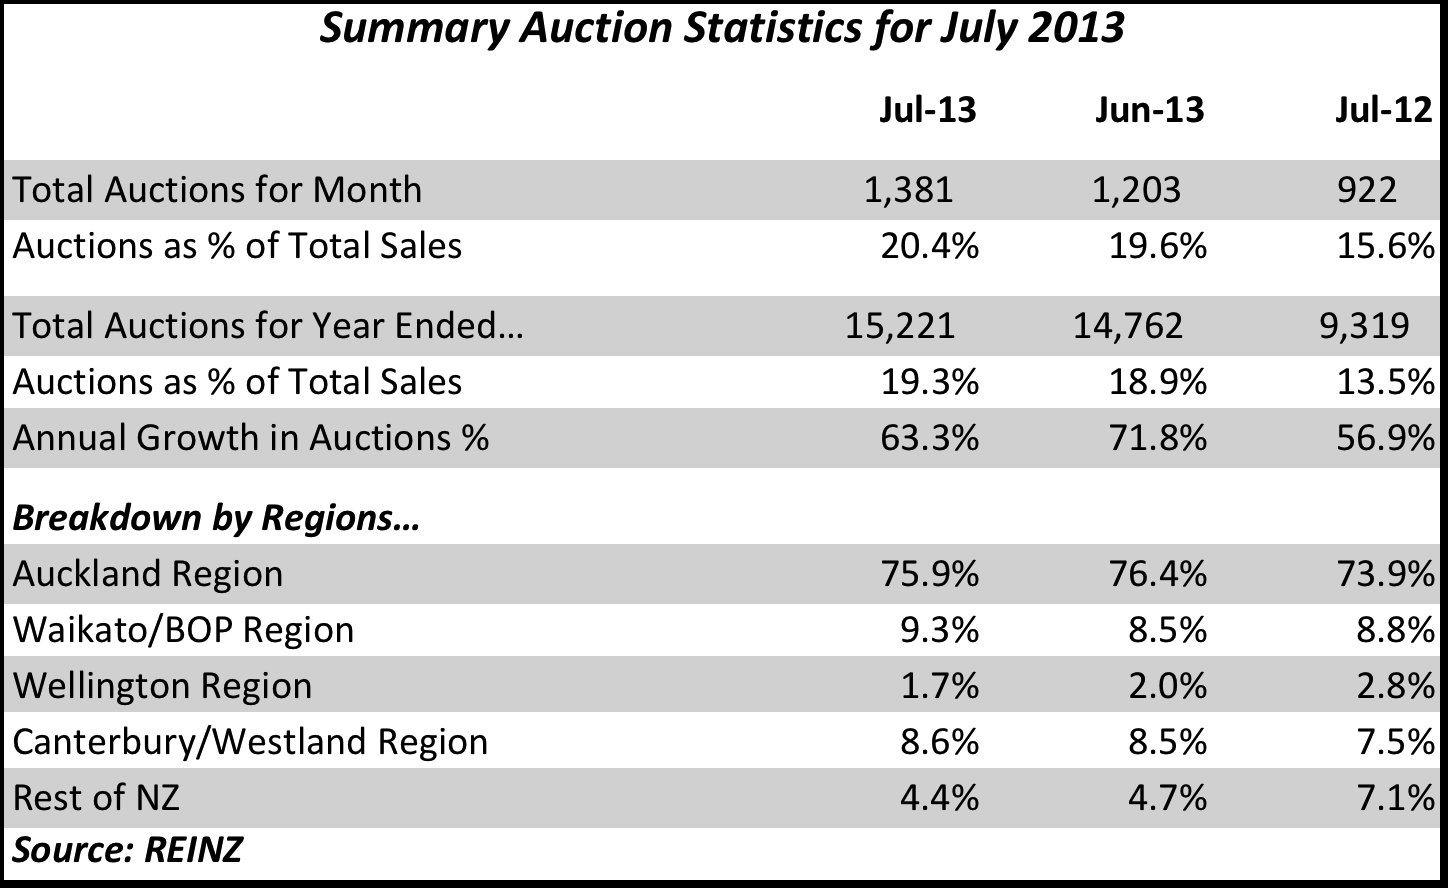
Auctions
Nationally
there were 1,381 dwellings sold by auction in July
representing 20.4% of all sales and an increase of 63.3% on
the number of dwellings sold by auction in July 2012.
Auctions are increasingly favoured as a sales method in
certain centres; for the 12 months to July 2013 the total
number of sales by auction reached 15,221 or 19.3% of all
sales, compared to 9,319 or 13.5% of all sales for the 12
months to July 2012.
Transactions in Auckland again dominated the auction market in June, representing 75.9% of the national total of auction sales. 38.1% of all dwelling sales in Auckland were by auction in July; this was up strongly from the 29.5% of sales by auction in July 2012. Sales by auction in Waikato/Bay Of Plenty accounted for 9.3% of the national total, Canterbury/Westland accounted for 8.6% of the national total, and all other regions combined accounted for the remaining 6.1% of auction sales in July 2013.
Click for big version.
Further
Data
Across New Zealand the total value of
residential sales, including sections was $3.31 billion in
July, compared to $3.06 billion in June, and $2.52 billion
in July 2012. For the 12 months ended July 2013 the total
value of residential sales was $38.04 billion.
The breakdown of the value of properties sold in July 2013 is:
$1 million plus 361 5.3%
$600,000 to
$999,999 1,161 17.1%
$400,000 to
$599,999 1,694 25.0%
Under
$400,000 3,561 52.5%
All Properties
Sold 6,777 100.0%
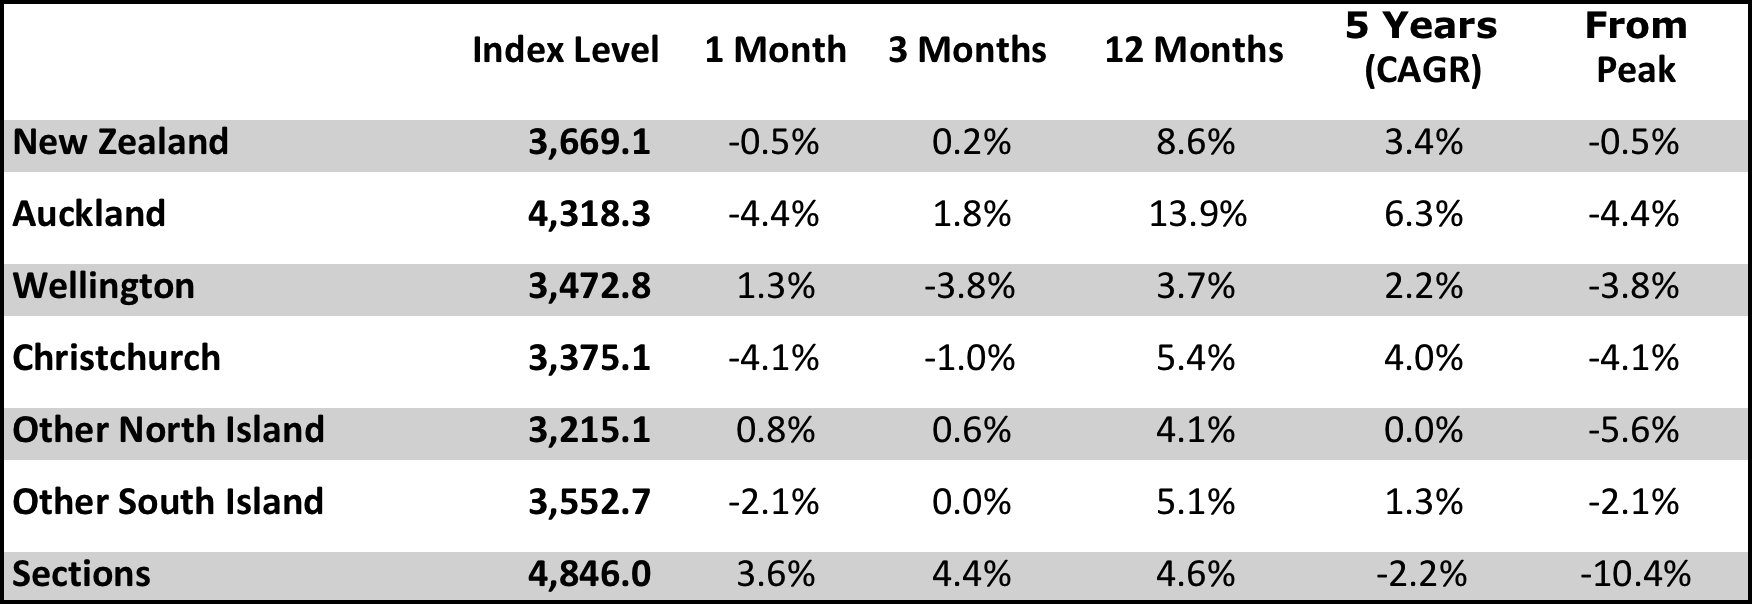
REINZ Stratified Median Housing Price Index
The REINZ Housing Price Index decreased 0.5% in July compared with June to sit at 3,669.1. Auckland fell by 4.4% in July, Christchurch fell 4.1% and Wellington fell 1.3%. For the 12 months to July, the Auckland Index rose 13.9%, the Christchurch Index rose 5.4% and the Wellington Index increased 3.7%. The National Index increased 8.6% compared to July last year.
Click for big version.
* CAGR is
Compound Annual Growth Rate
* The Christchurch
data needs to be treated with some caution due to
compositional changes in the suburb mix caused by the
earthquakes in the city
REINZ Stratified Median Housing Price Index Chart
Click for big version.
REINZ
July 2013 Regional Date:
http://img.scoop.co.nz/media/pdfs/1308/REINZ_July_2013__Regional_Data.pdf
REINZ
Property Market Report:
http://img.scoop.co.nz/media/pdfs/1308/REINZ_Residential_Market_Statistics__July_2013.pdf
ENDS
 NIWA: Students Representing New Zealand At The ‘Olympics Of Science Fairs’ Forging Pathway For International Recognition
 Coalition to End Big Dairy: Activists Protest NZ National Dairy Industry Awards Again
 Infoblox: Dancing With Scammers - The Telegram Tango Investigation
 Consumer NZ: This Mother’s Day, Give The Gift Of Scam Protection And Digital Confidence
 NZ Airports Association: Airlines And Airports Back Visa Simplification
 Netsafe: Statement From Netsafe About Proposed Social Media Ban