 Scoop has an Ethical Paywall


No sign of a slowdown
Media release
9th July
No
sign of a slowdown
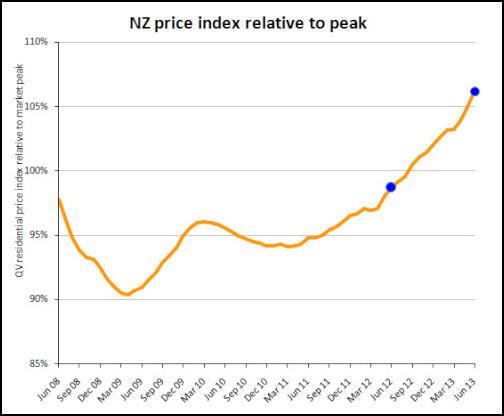
The latest monthly property
value index shows that nationwide residential values
increased further in June. Values increased 7.6% over the
past year, with an increase of 2.8% over the past three
months. Values are now up 6.2% over the previous market
peak of late 2007.
Kerry Stewart, QV Operations Manager said “Nationwide values continue to increase although only about half as quickly as they did in the years leading up to the 2007 market peak. Auckland values however are increasing at a faster rate than they did before the previous peak. This shows that so far the strong increase in values is largely constrained to Auckland and Canterbury, with value increases across the rest of the country still largely subdued.”
“There is little sign that values will slow in Auckland in the immediate future. The number of properties for sale is continuing to drop while demand remains strong. Christchurch is also suffering from a shortage of stock leading to upward pressure on prices. The rest of the country generally isn’t suffering from such a shortage so value increases are likely to remain modest,” said Stewart.
Auckland
Values across
Auckland are still increasing, and over the past three
months values have accelerated further. Whereas some areas
like Rodney and old Auckland city had slowed a little
earlier in the year, old Auckland City is now leading the
way with a 4.7% increase over the past 3 months. Waitakere
and North Shore are close behind though, both seeing 4.6%
increases.
Overall, values across Auckland are 12.6% above last year, with North Shore, Waitakere and old Auckland City increasing by 13.2 – 13.4% while Rodney and Papakura increased at just over 9%.
QV Operations Manager Kerry Stewart said “With buyers still searching for reasonably priced property, South Auckland seems to be becoming more attractive. The lower end of the market here remains around $300,000, making it affordable for buyers. This is particularly driven by values in west Auckland increasing.”
“Property speculators are becoming more prominent also, especially in Otara, Otahuhu, Manurewa and parts of Manukau, and throughout the west investors and first home buyers appear to be upgrading,” he said.
“With a lack of supply still causing headaches for some buyers, some large scale developments in the west and block land starting to get developed are being talked about as having the potential to relax the market somewhat,” said Stewart.
Hamilton and
Tauranga
Outside of Auckland, most of the other
main centres are also increasing but at a much slower rate.
Hamilton values are up 1.1% over the last three months, and
3.9% over the past year.
QV Valuer Richard Allen said “There appears to be no seasonal slowdown in activity as winter takes hold. We expect the steady increase in values to continue with the market quite even in relation to supply and demand.”
Tauranga continues to fluctuate, with values now 0.5% below this time last year. However, there has been a 0.2% increase over the past three months.
QV Valuer Paul Thomas said “More and more first home buyers are entering the market and choosing to purchase instead of rent. This is despite a lack of supply caused by vendors who are happy to stay put at this time of the year. ”
Wellington
Values in the
Wellington area continue on a slow and steady path. Values
are 2.6% above this time last year with a 0.6% growth in the
last 3 months. Wellington City, Hutt City and Upper Hutt
have all picked up slightly, each around 2.6-2.8% up on last
year. Porirua still remains the area with the highest
increase, with values up 3.6% annually.
QV Valuer Kerry Buckeridge said “The market continues to show modest improvements even though sales appear to be down. This is generally due to a lack of listings as opposed to a lack of demand. We have seen some well presented, completely renovated and low maintenance homes that are close to the city achieving sales prices far beyond what was expected. There also appears to be good interest in the higher end of the market, around the $1-1.5 million mark.”
Christchurch and
Dunedin
Christchurch values have continued to
rise, and with a 10.4% increase over the past year is only a
little behind Auckland. Values in Selwyn have increased
10.6% over the past year, slightly more than Christchurch,
although over the past three months the rate has been slower
than Christchurch. Values have slowed their increase
considerably over the past year to be only 5.7% up.
QV Valuer Daryl Taggart said “Values in Christchurch continue to rise as we see more hype around the property market in the city particularly. This is also translating to more investors showing interest in the market.”
“Whereas outlying areas, such as Waimakariri and Selwyn, were growing much faster than Christchurch itself, but in recent months the reverse seems to be occurring. Sales in Waimakariri have levelled out, although more land being developed in Selwyn could see some extra interest there.
Dunedin has remained steady, with a 0.4% increase over the past three months. Values are 4% above last year.
QV Valuer Tim Gibson said “After what has been a promising first half of the year, property values have stabilised this month. However, there is still good demand for properties in the lower to mid price bracket with multi-offers prevalent.”
Provincial
centres
The provincial centres are seeing some
gains, with previously slow or declining areas now picking
up. This is seen in areas such as Gisborne, which has
increased 2% over the past three months, and Whangerei,
which has increased 2.5%. In the North Island, areas like
Taupo, Bay of Plenty and Rotorua have seen slight declines
over the past three months, but in the South Island it is
mainly only around Gore and Invercargill where we have seen
decrease in values.
| PropertyIQ Value Index - Residential Property | |||||
| Time period: as at June 2013 | |||||
| Territorial authority | Average current value | 12 month change% | 3 month change % | Since 2007 market peak change % | |
| Far North | 310,484 | 1.5% | 1.2% | -23.8% | |
| Whangarei | 330,932 | 1.1% | 2.5% | -16.4% | |
| Kaipara | 314,588 | 6.7% | 3.3% | -21.5% | |
| Auckland - Rodney | 611,976 | 9.1% | 3.7% | 3.4% | |
| Rodney - Hibiscus Coast | 613,733 | 9.7% | 4.1% | 4.5% | |
| Rodney - North | 608,796 | 8.6% | 3.0% | 1.4% | |
| #A | Auckland - North Shore | 753,581 | 13.2% | 4.6% | 17.5% |
| North Shore - Coastal | 870,646 | 13.6% | 5.3% | 15.5% | |
| North Shore - Onewa | 595,508 | 13.3% | 4.1% | 20.1% | |
| North Shore - North Harbour | 724,828 | 12.0% | 3.4% | 19.3% | |
| #A | Auckland - Waitakere | 487,479 | 13.3% | 4.6% | 14.5% |
| #A | Auckland - City | 760,912 | 13.4% | 4.7% | 22.0% |
| Auckland City - Central | 687,667 | 12.6% | 4.2% | 20.7% | |
| Auckland City - East | 936,874 | 12.1% | 3.9% | 17.6% | |
| Auckland City - South | 677,796 | 15.7% | 5.3% | 25.9% | |
| Auckland City - Islands | 691,442 | 7.7% | 4.0% | 8.2% | |
| #A | Auckland - Manukau | 524,636 | 12.1% | 3.8% | 14.2% |
| Manukau - East | 704,295 | 12.4% | 4.4% | 18.2% | |
| Manukau - Central | 398,578 | 11.8% | 2.8% | 6.0% | |
| Manukau - North West | 425,621 | 12.4% | 3.9% | 15.2% | |
| #A | Auckland - Papakura | 380,861 | 9.2% | 2.5% | 5.9% |
| Auckland - Franklin | 417,967 | 7.2% | 3.7% | 3.1% | |
| Thames Coromandel | 500,045 | 2.6% | 3.8% | -14.6% | |
| Hauraki | 244,316 | 0.8% | 1.8% | -14.4% | |
| Waikato | 270,247 | 3.6% | -0.2% | -16.6% | |
| Matamata Piako | 261,931 | 0.2% | 1.5% | -12.5% | |
| # | Hamilton | 348,399 | 3.9% | 1.1% | -5.9% |
| Hamilton - North East | 435,313 | 4.6% | 2.5% | -3.2% | |
| Hamilton - Central & North West | 327,776 | 3.0% | 1.1% | -8.4% | |
| Hamilton - South East | 321,272 | 4.0% | -0.6% | -8.1% | |
| Hamilton - South West | 310,843 | 2.8% | 0.1% | -9.2% | |
| Waipa | 321,948 | 2.9% | 0.0% | -4.8% | |
| Otorohanga | N/A | N/A | N/A | N/A | |
| South Waikato | 127,423 | -3.9% | -0.1% | -22.0% | |
| Waitomo | 137,604 | -7.2% | -8.7% | -37.9% | |
| Taupo | 347,876 | -0.2% | -0.1% | -14.2% | |
| Western BOP | 391,661 | 0.5% | -3.2% | -14.0% | |
| # | Tauranga | 428,943 | -0.5% | 0.2% | -10.7% |
| Rotorua | 269,015 | 1.4% | -0.7% | -13.4% | |
| Whakatane | 295,125 | 0.6% | -0.1% | -15.0% | |
| Kawerau | 105,442 | -12.3% | 2.1% | -34.6% | |
| Opotiki | 206,934 | -1.1% | 0.8% | -26.4% | |
| Gisborne | 230,983 | 1.4% | 2.0% | -23.6% | |
| Wairoa | N/A | N/A | N/A | N/A | |
| Hastings | 299,270 | 3.0% | 0.9% | -4.7% | |
| # | Napier | 324,102 | 3.1% | 2.0% | -5.1% |
| Central Hawkes Bay | 201,423 | -7.2% | -5.8% | -24.8% | |
| New Plymouth | 335,447 | 4.0% | 1.7% | 0.3% | |
| Stratford | 195,246 | 5.5% | 0.6% | -10.2% | |
| South Taranaki | 182,286 | -1.7% | 4.5% | -8.2% | |
| Ruapehu | 135,113 | -6.9% | -2.6% | -25.6% | |
| Wanganui | 190,345 | 0.7% | 1.3% | -13.2% | |
| Rangitikei | 147,711 | 1.1% | -0.3% | -17.8% | |
| Manawatu | 237,053 | 1.0% | -0.9% | -6.7% | |
| # | Palmerston North | 285,693 | 2.7% | 0.6% | -4.9% |
| Tararua | 158,102 | 5.1% | 0.6% | -9.3% | |
| Horowhenua | 199,718 | 0.7% | 0.2% | -16.5% | |
| Kapiti Coast | 363,142 | 2.4% | -0.2% | -5.4% | |
| #W | Porirua | 377,294 | 3.6% | 1.0% | -1.5% |
| #W | Upper Hutt | 334,336 | 2.8% | 0.7% | -5.9% |
| #W | Hutt | 367,696 | 2.6% | 1.2% | -7.4% |
| #W | Wellington | 525,245 | 2.6% | 0.4% | -2.3% |
| Wellington - Central & South | 533,597 | 2.3% | 0.7% | -4.8% | |
| Wellington - East | 566,876 | 1.5% | -1.0% | -1.6% | |
| Wellington - North | 458,564 | 2.0% | 0.3% | -1.6% | |
| Wellington - West | 607,937 | 5.0% | 1.6% | 0.1% | |
| Masterton | 237,345 | -0.1% | 0.3% | -18.0% | |
| Carterton | 253,156 | 2.1% | -0.8% | -8.3% | |
| South Wairarapa | 291,245 | 0.3% | 1.3% | -15.0% | |
| Tasman | 401,791 | 3.4% | 0.3% | 0.9% | |
| # | Nelson | 393,797 | 4.0% | 1.0% | 3.1% |
| Marlborough | 343,229 | 1.9% | 0.8% | -12.1% | |
| Kaikoura | N/A | N/A | N/A | N/A | |
| Buller | 221,277 | 1.9% | -0.8% | 6.6% | |
| Grey | 214,695 | -2.8% | -2.3% | -10.9% | |
| Westland | 227,975 | 0.6% | 4.8% | -8.1% | |
| Hurunui | 326,250 | 8.5% | 0.3% | 3.1% | |
| Waimakariri | 378,317 | 5.7% | 2.2% | 18.7% | |
| # | Christchurch | 429,378 | 10.4% | 3.8% | 12.0% |
| Christchurch - East | 329,788 | 9.2% | 2.8% | 6.6% | |
| Christchurch - Hills | 601,403 | 8.9% | 2.7% | 8.7% | |
| Christchurch - Central & North | 496,173 | 11.6% | 4.2% | 12.1% | |
| Christchurch - Southwest | 396,483 | 10.4% | 3.9% | 16.8% | |
| Christchurch - Banks Peninsula | 512,389 | 16.5% | 8.2% | 6.7% | |
| Selwyn | 463,678 | 10.6% | 2.8% | 22.9% | |
| Ashburton | 301,419 | 9.3% | 1.9% | 7.6% | |
| Timaru | 267,474 | 5.3% | 1.8% | 5.9% | |
| MacKenzie | 278,749 | 6.4% | 2.0% | -5.7% | |
| Waimate | 188,828 | 5.2% | 2.1% | -1.5% | |
| Waitaki | 218,080 | 2.9% | 1.3% | -4.6% | |
| Central Otago | 300,637 | 2.7% | 2.4% | -5.3% | |
| Queenstown Lakes | 636,727 | 4.0% | 1.5% | -10.9% | |
| # | Dunedin | 285,509 | 4.0% | 0.4% | -0.4% |
| Dunedin - Central & North | 294,368 | 4.0% | 0.9% | -2.4% | |
| Dunedin - Peninsular & Coastal | 260,462 | 0.9% | 1.8% | -3.8% | |
| Dunedin - South | 276,976 | 5.8% | -0.5% | -3.0% | |
| Dunedin - Taieri | 294,326 | 3.7% | 0.1% | 0.2% | |
| Clutha | 156,006 | -5.0% | -6.6% | -14.0% | |
| Southland | 208,986 | -2.7% | 1.0% | -10.2% | |
| Gore | 177,248 | -2.4% | -3.5% | 0.2% | |
| # | Invercargill | 204,158 | -0.7% | -2.0% | -9.0% |
| Auckland Area | 639,385 | 12.6% | 4.5% | 17.0% | |
| Wellington Area | 444,691 | 2.6% | 0.6% | -3.3% | |
| # | Main Urban Areas | 506,703 | 9.3% | 3.2% | 10.5% |
| Total NZ | 441,254 | 7.6% | 2.8% | 6.2% | |
| Notes on the above data: | |||||
| 1. The information included in the above table is based on the monthly property value index. This index is calculated based on the sales data entered into PropertyIQ's system in the previous 3 month period. For example, information for the period ending June will be calculated based on sales entered between April 1 and June 30. | |||||
| 2. The average current value is the average (mean) value of all developed residential properties in the area based on the latest index. It is not an average or median sales price, as both of those only measure what happens to have sold in the period. | |||||
| 3. The percentage change over three months, twelve months and since the 2007 market peak are based on the change in the property value index between that time and the current. | |||||
| 4. Any of the statistical data shown in italics are calculated based on a sample set of data that is less than the recommended minimum. These results should be used with caution. Those showing N/A had too few sales to generate an index | |||||
With the relaunch of QV.co.nz comes a new way we have calculated the statistics for Auckland Area. Auckland Area is now being calculated based on the super city, covering the entire Auckland region. You can see all the historical data for Auckland Area and how it has tracked over time by using our Monthly Residential Value Index tool on QV.co.nz.
 Vegetables New Zealand: Asparagus Season In Full Flight: Get It While You Still Can
  Bill Bennett: Download Weekly - How would NZ telecoms cope with another cyclone
 NZ On Air: Firm Audience Favourites Lead NZ On Air Non-Fiction Funding
 Insurance and Financial Services Ombudsman: Woman Gets $40k More After Disputing Insurer’s Decision
 BNZ: A Quarter Of Older NZers Fear Going Online Due To Scam Concerns
 University of Auckland: Scientists Develop Tool To Monitor Coastal Erosion In Fine Detail


