 Scoop has an Ethical Paywall


Buses, trains and traffic jams: Wellington vs Auckland vs NZ
Tuesday, 21 May 2013
Buses, trains and traffic jams: New Zealand’s public transport under the spotlight
Using public/private transport: how
Kiwis get from A to B in an average three-month period
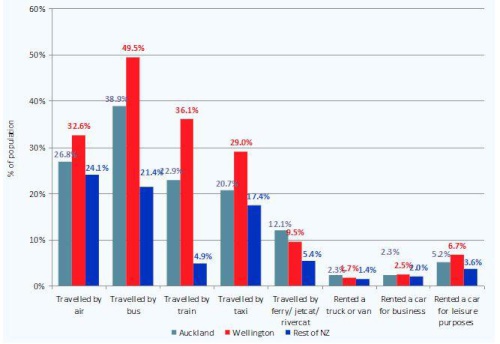
Source: Roy Morgan
Single Source (New Zealand), April 2012 – March 2013
Base: New Zealand population
aged 14+
Just ask any traveller: you can tell a lot about a city by its public transport. Take Auckland and Wellington, for example. While a substantial proportion of Wellingtonians use their city’s bus and rail systems, it seems the majority of Aucklanders would rather drive, according to the latest Roy Morgan State of the Nation New Zealand report.
Almost half of Wellington’s population (49.5%) caught a bus in any given three-month period during the last year, and 36.1% took the train. In Auckland, on the other hand, a much lower 38.9% of residents travelled by bus and just 22.9% by train.
Taxi usage is also higher in Wellington, with 29% of residents travelling by cab in an average three months (compared to 20.7% of Aucklanders).
The flipside of this scenario, of course, is that Aucklanders drive more than Wellingtonians, racking up an average 14,000km per year (compared to 12,800km in Wellington). Though this will come as no surprise to anyone who’s experienced the city’s notoriously congested traffic, it’s lower than the rest of New Zealand, where the average distance driven per year is 14,600km.
Michele Levine, CEO, Roy Morgan Research, says:
“With its electric train system and reliable bus services, Wellington provides a more user-friendly public transport system than Auckland, resulting in a much higher rate of public transport use across age groups, genders and other demographics.
“In contrast, Auckland’s public transport system has not been able to meet the increasing demands of a rapidly growing population. Auckland Council is all too aware of this situation, flagging the city’s ‘overburdened and inefficient’ transport system as a priority in their long-term strategy The Auckland Plan.
“Plans for a fully electric train system by 2016 and a CBD City rail link by 2021 should ease the pressure, but for the next few years at least, the love affair between Aucklanders and their cars looks set to continue.
“Having larger distances to cover and fewer public transport options, rural Kiwis in the rest of the country will also keep clocking up the kilometres on their odometers.
“Public transport is just one of the regional differences explored in our ‘Spotlight on Auckland vs Wellington vs Rest of New Zealand’, along with areas such as attitudes, housing, technology and more.”
In this Roy Morgan State of the Nation Report, we have measured all of these issues and more – plotted them over time – and explored in more detail how they have played out, in terms of Society, Technology, Economy, Politics, and Environment. Click here to view the report and other Roy Morgan reports and data.
ENDS
Please click on this link to the Roy Morgan Online Store
About Roy Morgan Research
Roy Morgan Research is the largest independent Australian research company, with offices in each state of Australia, as well as in New Zealand, the United States and the United Kingdom. A full service research organisation specialising in omnibus and syndicated data, Roy Morgan Research has over 70 years’ experience in collecting objective, independent information on consumers.
In Australia, Roy Morgan Research is considered to be the authoritative source of information on financial behaviour, readership, voting intentions and consumer confidence. Roy Morgan Research is a specialist in recontact customised surveys which provide invaluable and effective qualitative and quantitative information regarding customers and target markets.
Roy Morgan Research New Zealand
Roy Morgan Research was set up in New Zealand in the 1990s and has been collecting information across a wide range of industries in New Zealand ever since. Roy Morgan currently has over 10 years of trended data on a geographically and demographically representative sample of over 12,000 New Zealanders aged 14+.
Margin of Error
The margin of error to be allowed for in any estimate depends mainly on the number of interviews on which it is based. Margin of error gives indications of the likely range within which estimates would be 95% likely to fall, expressed as the number of percentage points above or below the actual estimate. Allowance for design effects (such as stratification and weighting) should be made as appropriate.
| Sample Size | Percentage Estimate | |||
| 40%-60% | 25% or 75% | 10% or 90% | 5% or 95% | |
| 5,000 | ±1.4 | ±1.2 | ±0.8 | ±0.6 |
| 7,500 | ±1.1 | ±1.0 | ±0.7 | ±0.5 |
| 10,000 | ±1.0 | ±0.9 | ±0.6 | ±0.4 |
| 20,000 | ±0.7 | ±0.6 | ±0.4 | ±0.3 |
Roy Morgan Research
New Zealand's leading social and market research company
A full service research organisation specialising in omnibus and syndicated data, Roy Morgan Research has over 70 years' experience in collecting objective, independent information on consumers. Roy Morgan Research was set up in New Zealand in the 1990s and has been collecting information across a wide range of industries in New Zealand ever since. Roy Morgan currently has over 10 years of trended data on a geographically and demographically representative sample of over 12,000 New Zealanders aged 14+.
 NZ Customs Service: Customs Agencies Bolster New Zealand-India Engagement To Improve Market Access
  GNS Science: Laser Technology On Subsea Cables Could Provide Earlier Tsunami Warning For The Pacific
 The Reserve Bank of New Zealand: RBNZ Supports Release Of Police’s National Risk Assessment
 Bill Bennett: Download Weekly - ComCom Recommends Removing Rural Copper Regulations
 Hugh Grant: Why Pay Equity Software Is Essential For A Strong Employee Value Proposition
 Electricity Authority: Electricity Authority Acts Quickly To Strengthen Security Of Electricity Supply Ahead Of Winter


