 Scoop has an Ethical Paywall


Solid Start for Real Estate Market In 2013
News Release 12 February 2013
Solid Start for Real Estate Market In 2013
Summary
• 4,933
houses sold in January 2013, an increase of 21% on January
2012
• National median house price up 4.2%
compared to January 2012, but eases 4.9% from December
2012
• New record median house price for
Taranaki
• Sales by auction in January 2013
almost double those of January 2012
Robust demand drove sales volume growth in the residential property market during January to the highest level for the month in five years with the number of sales up 21 per cent on January 2012.
The national median price rose 4.2% compared to January 2012 to $370,000 but eased from the record $389,000 established in December 2012.
The Chief Executive of the Real Estate Institute of New Zealand (REINZ), Helen O’Sullivan, says that the residential real estate market has begun 2013 well, continuing the trend that developed during 2012.
“The residential real estate market has begun 2013 in good shape with a more than 20% increase in sales volume on this time last year. The national median price eased from its December level, although it remained 4.2% above the level reported at the same time last year. Given the highly seasonal nature of the housing market, prices and volumes tend to ease from their year end levels in January, as marketing campaigns for many properties in the upper price bracket don’t begin until the latter half of the month.”
“Agents across the country are reporting continuing shortages of listings and positive buyer enquiry, even after taking into account the normal slowdown in activity over the Christmas/New Year break. The six day improvement in the number of days to sell between January 2013 and January 2012 is indicative of high levels of buyer activity in markets across the country.”
Sales Volumes
REINZ data shows
there were 4,933 unconditional residential sales in January,
an increase of 860 sales (+21.1%) compared with the same
time last year and a fall of 14.3% compared to December
2012. This is in line with the normal seasonal trends at
this time of the year, as the shorter trading month (due to
the Christmas/New Year break) always results in a lower
sales tally in January compared to December. On a
seasonally adjusted basis January’s sales were in line
with what would be expected at this time of the year.
All but one region recorded increases in sales volume compared to January last year, with Southland recording an increase of 40.4%, followed by Northland with 38.5% and Auckland with 26.7%. Only Southland recorded an increase in sales volume in January compared to December, with a 2.5% increase, while Taranaki recorded the same number of sales as December.
Prices
The
national median house price fell by $19,000, from $389,000
in December, to $370,000 in January; a drop of 4.9%.
Taranaki recorded a new record high median of $310,500 in
January with a 10.5% increase compared to December. Hawkes
Bay was the only other region to record an increase in the
median price in January. The national median house price is
up 4.2% compared to January 2012, while the Auckland median
price is up 8.1% compared to January 2012. The Canterbury/
Westland median rose 5.8% and Nelson/Marlborough 4.6%.
The REINZ Stratified Housing Price Index, which adjusts for some of the variations in mix that can impact on the median price, is 7.2% higher than January 2012 and eased 1.0% compared to December. The Auckland Stratified Housing Price Index is up almost 12% compared to January 2012.
Days To Sell
Houses took nine
days longer to sell in January 2013, following the usual
seasonal pattern, compared to December 2012, easing from 32
days in December to 41 days in January. Compared to January
2012, the number of days to sell improved by six days. All
regions, with the exception of Hawkes Bay and Taranaki, saw
an improvement in the number of days to sell between January
2012 and January 2013.
For the month of January, Canterbury/Westland recorded the shortest days to sell at 31 days, followed by Auckland with 33 days and Nelson/Marlborough with 40 days. Waikato/Bay of Plenty and Hawkes Bay both recorded the longest number of days to sell at 60 days, followed by Northland with 59 days and Taranaki with 55 days. Over the past 10 years the median days to sell for the month of January has averaged 44 days across New Zealand.
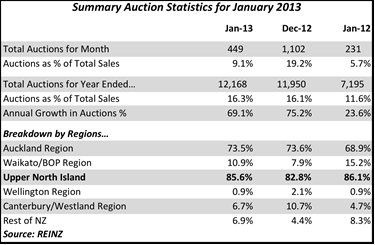
Auctions
Nationally
there were 449 dwellings sold by auction in January
representing 9.1% of all sales, almost double the number of
sales by auction compared to January 2012. For the 12 months
to January the total number of auctions reached 12,168 or
16.3% of all sales, compared to 7,195 or 11.6% of all sales
for the 12 months to January 2012.
Transactions in Auckland again dominated the auction market in January, representing 73.5% of the national total of auction sales. 18.3% of all dwelling sales in Auckland were by this method in January; this was up strongly from the 11.2% of sales by auction in January 2012. Sales by auction in Waikato/Bay Of Plenty accounted for 10.9% of the national total, Canterbury/Westland accounted for 6.7% of the national total, and all other regions combined accounted for the remaining 8.9% of auction sales in January 2013.
Click for big version.
Further Data
Across New Zealand the total value of
residential sales, including sections was $2.24 billion in
January, compared to $2.73 billion in December, and $1.72
billion in January 2012. For the 12 months ended January
2013 the total value of residential sales was $34.47
billion.
The breakdown of the value of properties sold in January 2013 is:
$1 million plus 167 3.4%
$600,000
to$999,999 711 14.4%
$400,000 to
$599,999 1,299 26.3%
Under
$400,000 2,756 55.9%
All Properties
Sold 4,933 100.0%
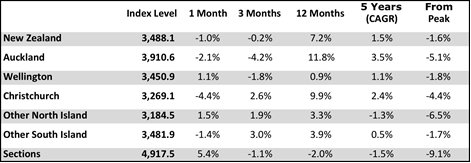
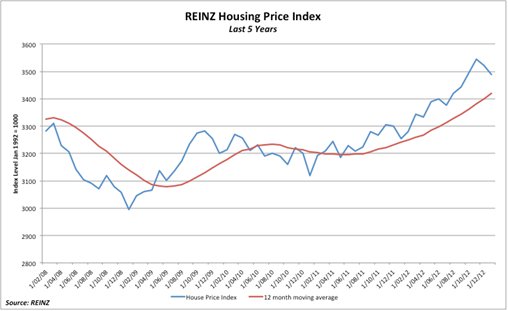
REINZ Stratified
Median Housing Price Index
The REINZ Housing
Price Index eased 1.0% in January compared with December to
sit at 3,488.1. Wellington rose 1.1% in January, while
Auckland fell 2.1% and Christchurch 4.4%. For the 12 months
to January, the Auckland Index rose 11.8% and the
Christchurch Index rose 9.9% compared to the National Index
increase of 7.2%. Outside of the main centres, the Other
South Island Index was the next strongest with an increase
of 3.9% for the 12 months to January 2013.
Click for big version.
* CAGR is
Compound Annual Growth Rate
* The Christchurch
data needs to be treated with some caution due to
compositional changes in the suburb mix caused by the
earthquakes in the city
REINZ Stratified Median Housing Price Index Chart
Click for big version.
REINZ_Residential_Market_Statistics__January_2013.pdf
ENDS
 Dawn Aerospace: Historic Flight - Breaks Sound Barrier And Global Records
 SEEK: SEEK NZ Employment Report - October
 University of Auckland: Protecting Young Minds With AI
 Greenpeace: Greenpeace Calls On Fonterra Investors To Consider Big Picture With Giant Puzzle
 Hugh Grant: How New Tech Helps Kids Love Soccer More
 Bill Bennett: Download Weekly - 100% claim lands One New Zealand in criminal court action


