 Scoop has an Ethical Paywall


Electricity Information for Sunday 26 August
Electricity Information for Sunday 26 August 2001
National Savings 6.9%
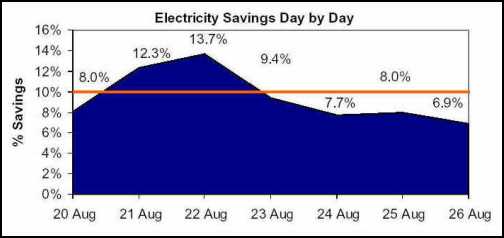
National Savings Day by Day
Actual daily electricity savings for the past week are shown below. This data shows exactly what the country saved each day. This data has been seasonally adjusted.
National Savings –
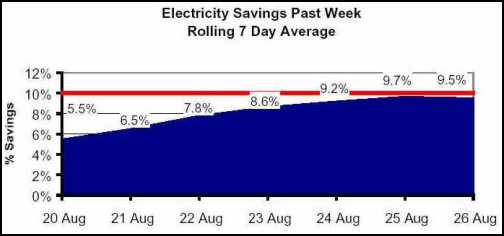
7 Day Rolling Average
The following graph is a seven-day
rolling average. The data has been seasonally
adjusted.
Regional
Savings Trend
The following table shows regional savings using the seven-day rolling average calculation.
A B C D E NZ
Mon 20 Aug 4.22% 7.19% 4.41% 6.66% 5.93% 5.47%
Tue
21 Aug 4.73% 7.92% 5.89% 9.07% 6.40% 6.49%
Wed 22 Aug
6.03% 8.55% 7.78% 11.68% 6.68% 7.79%
Thu 23 Aug 6.86%
8.72% 9.51% 13.11% 6.80% 8.64%
Fri 24 Aug 7.48% 8.41%
10.26% 14.55% 7.09% 9.19%
Sat 25 Aug 8.16% 7.59% 11.21%
15.97% 7.08% 9.66%
Sun 26 Aug 8.73% 6.23% 10.68% 16.18%
7.00% 9.51%
This information has also been seasonally
adjusted.
Actual Demand
The following table shows actual regional and national demand in MWh.
A B C D E NZ
Mon 20
Aug 29,039 15,934 19,342 15,021 20,644 99,982
Tue 21 Aug
28,994 15,683 18,880 14.367 20,703 98,628
Wed 22 Aug
28,580 15,356 18,967 13,771 20,471 97,146
Thu 23 Aug
28,565 16,008 19,504 14,958 21,005 100,042
Fri 24 Aug
28,283 16,394 19,176 14,081 20,712 98,646
Sat 25 Aug
24,582 16,148 16,626 12,298 20,022 89,676
Sun 26 Aug
23,562 15,737 17,403 12,474 19,841 89,017
As a reminder,
the regions are:
A Auckland & Northland D Nelson,
Marlborough, West Coast, Canterbury
B Waikato, Bay of
Plenty, King Country E Otago & Southland
C Taranaki,
Hawkes’ Bay, Manawatu, Wellington
Daily Average
Wholesale Prices (c/kWh)
20 Aug 21 Aug 22 Aug 23 Aug 24 Aug 25 Aug 26 Aug
Otahuhu 9.65 9.28 8.67 9.08 7.64 7.56
5.37
Haywards 10.51 10.56 9.60 9.88 8.10 7.43
5.64
Benmore 10.82 11.11 10.50 11.09 9.04 7.66
7.11
Pricing Trends – Seven Day Rolling Average
The M-co Electricity Price Index is a seven-day rolling-average electricity price. It is weighted by load for each of three areas and nationally. This means although the price may fall in the daily average energy prices above, the M-co Electricity Price Index could continue to rise due to earlier high prices.
M-co Electricity Price Index (c/kWh)
20 Aug 21 Aug 22 Aug 23 Aug 24 Aug 25 Aug 26 Aug
Upper North Island 11.41 10.66 9.89 9.58 9.17 8.77
8.63
Lower North Island 12.12 11.32 10.48 10.17 9.70 9.24
9.03
South Island 12.55 11.81 11.21 11.07 10.69 10.25
10.30
New Zealand 11.93 11.17 10.45 10.20 9.80 9.37
9.29
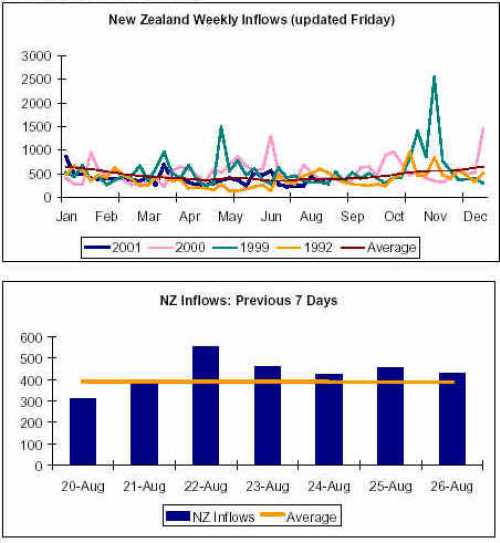
Lake Inflows
 GNS Science: Bioshields Could Help Slow Tsunami Flow
 Transport and Infrastructure Committee: Inquiry Into Ports And The Maritime Sector Opened
 Netsafe: Netsafe And Chorus Power Up Online Safety For Older Adults
 RBNZ: 10 Cent Coin With King Charles III Image Now In Production
 NZALPA: Safety Improves From AKL Incident Learnings
 NIWA: Antarctic Footprint Clean-up Challenges - How A Remote Antarctic Base Clean-up Protected One Of Earth’s Clearest Lakes