 Scoop has an Ethical Paywall


Electricity Information For Monday 20 August 2001
National Savings 8%
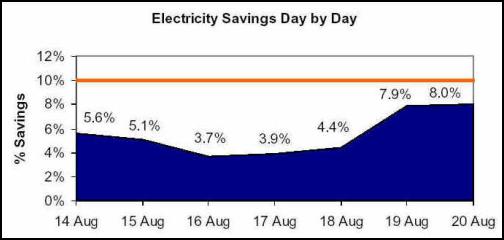
National Savings Day by Day
Actual daily electricity
savings for the past week are shown below. This data shows
exactly what the country saved each day. This data has been
seasonally adjusted.
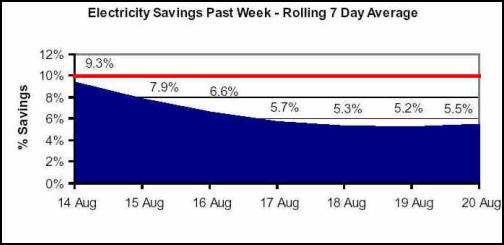
National Savings –
7 Day Rolling Average
The following graph is a
seven-day rolling average. The data has been seasonally
adjusted.
Regional Savings
for 20 August 2001
The graph below shows regional
savings based on 5 regions across the country for Monday
20
August and has been seasonally adjusted. More detailed
local information may be available from
electricity
distribution companies.
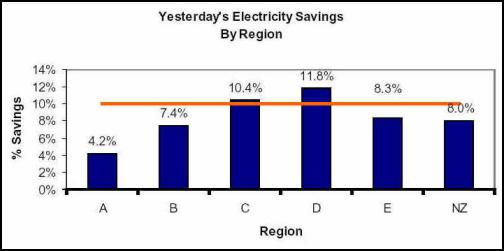
The regions are:
A
Auckland & Northland
B Waikato, Bay of Plenty, King
Country
C Taranaki, Hawkes’ Bay, Manawatu,
Wellington
D Nelson, Marlborough, West Coast,
Canterbury
E Otago &
Southland
 Raise Communications: NZ Careers Expo Kicks Off National Tour Amid Record Unemployment
 Hugh Grant: How To Build Confidence In The Data You Collect
 Tourism Industry Aotearoa: TRENZ 2026 Set To Rediscover Auckland As It Farewells Rotorua - The Birthplace Of Tourism
 NIWA: Students Representing New Zealand At The ‘Olympics Of Science Fairs’ Forging Pathway For International Recognition
 Coalition to End Big Dairy: Activists Protest NZ National Dairy Industry Awards Again
 Infoblox: Dancing With Scammers - The Telegram Tango Investigation