 Scoop has an Ethical Paywall


Northern regions lead population growth
New Zealand’s four northernmost regions accounted for
almost 60 percent of the country’s population growth
between 2013 and 2019, Stats NZ said today.
These regions – Auckland, Northland, Waikato, and Bay of Plenty – collectively grew by 321,400, and are now home to 54 percent of New Zealand’s population.
These are the first subnational population estimates to fully incorporate the 2018 Census and 2018 post-enumeration survey (PES) results. Estimates back to 2013 have now been revised. This is a normal revision that takes place after census and PES results are available. Estimates after 30 June 2018 now use the 2018-base estimated resident population as the starting-point.
"One of the purposes of running a census is to recalibrate national and sub-national population estimates," population insights senior manager Brooke Theyers said.
"The census coverage results from the 2018 PES, also released today, are crucial to ensure the population estimates are the best possible measure of how many people live in every community across New Zealand."
At the national level, the June 2018 population estimates have been revised up 60,000 (1.2 percent). This revision is spread across New Zealand, with estimates for most areas up slightly, and estimates for some areas down slightly.
"The recalibration of the estimates has generally confirmed the subnational trends evident in the initial population estimates."
Auckland region had the largest population growth, increasing by 187,300 people from 1,493,200 in 2013 to 1,680,500 in 2019. This is equivalent to the population of Dunedin and Invercargill cities combined being added to Auckland over six years. Auckland’s average population growth rate was 2.0 percent a year.
“Although Auckland has the largest population, other regions have seen faster growth since 2013,” Mrs Theyers said.
“Net migration drove the growth in these regions which reflected the significant contribution of international migration to New Zealand’s overall population growth.”
Bay of Plenty had an average annual growth rate of 2.7 percent, followed by Northland at 2.4 percent and Waikato at 2.3 percent.
Otago also grew by 2.3 percent a year, driven by growth in Queenstown-Lakes district.
The West Coast had the only population decrease among the 16 regions, down by 700 between 2013 and 2019.
Population change is due to both natural increase (births less deaths) and net migration (migrant arrivals less migrant departures). At the subnational level, net migration includes international migration (movements in and out of New Zealand) and internal migration (movements within New Zealand).
Text alternative for map
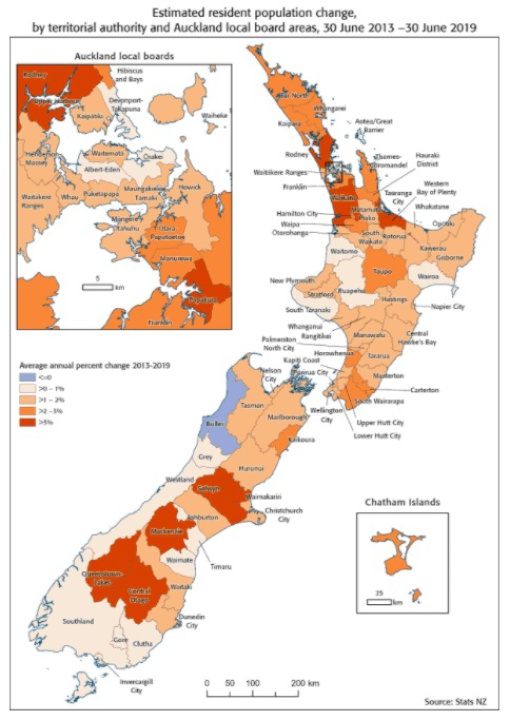
Estimated resident population change, by territorial
authority and Auckland local board areas, 30 June 2013 –30
June 2019
The map shows the territorial authority and Auckland local board areas, each of which is assigned a colour to show the range of change in estimated resident population from 30 June 2013 to 30 June 2019. The colours are grouped into average annual percent change 2013–2019 of: less than zero; greater than zero to one percent; greater than one to two percent; greater than two to three percent; greater than three percent. The average annual change ranged from 7.1 percent growth in Queenstown-Lakes District to 1.5 percent decline in Buller district. Data is available from Subnational population estimates (TA, SA2), by age and sex, at 30 June 1996-2019 (2020 boundaries).
Among the 67 territorial authority areas, the fastest growing between 2013 and 2019 were Queenstown-Lakes District (up 7.1 percent on average each year), Selwyn District (6.0 percent), and Central Otago District (3.7 percent). Buller District had an average decrease of 1.5 percent a year.
Auckland local areas see growth across the board
Between 2013 and 2019, the population increased in all 21 local board areas within Auckland. Papakura was the fastest-growing local board area, increasing 4.7 percent a year on average. The next fastest-growing areas were Rodney (3.7 percent), Upper Harbour (3.2 percent), Manurewa (2.9 percent), and Hibiscus and Bays (2.8 percent).
Subnational population estimates at 30 June 2020 (provisional) will be published on 22 October 2020.
Interactive maps show ethnicity differences across New Zealand
“The latest ethnic population estimates show that about two-thirds of New Zealand’s Asian and Pacific populations live in Auckland, and about half of our Middle Eastern, Latin American and African population,” Mrs Theyers said.
“Overall, Auckland is home to just over one-third of New Zealand’s total population.”
Estimated resident population (ERP) at 30 June 2018 – interactive map has more information on the level 1 ethnic group populations across New Zealand.
The ethnic population estimates are the best available measure of the size, age-sex structure, and geographic location of broad ethnic group populations. However, census counts remain the best data source for detailed ethnicity data and analysis across a range of census variables (see Ethnic group summaries reveal New Zealand's multicultural make-up).
 Gordon Campbell: On The Fall And Rise Of Pat Garrett And Billy The Kid
 Taxpayers' Union: Poor Data Privacy A Problem Throughout The Public Sector
 Gaming Machine Association of NZ: Gaming Machine Association To Work With With Local Councils To Develop Relocation Policies In Light Of Court Decision
 Biosecurity New Zealand: Biosecurity NZ Investigating And Boosting Trapping After New Auckland Fruit Fly Find
 NZ Labour Party: Two Labour Members’ Bills Drawn From Ballot
 Green Party: Right To Repair Bill Passes Significant Step
 Te Pati Maori: No ‘Māori Privilege’ In Education