 Scoop has an Ethical Paywall


Choice returning to Auckland market after summer holiday
NEWS RELEASE 14 February 2017
Choice returning to Auckland market after summer holiday
Sales volumes see seasonal drop in January as Auckland & national median house prices rise year-on-year
Aucklanders are once again starting to put their houses on the market, according to the latest figures released today by Real Estate Institute of New Zealand (REINZ), source of the most recent, complete and accurate real estate data in New Zealand.
After months of record low numbers of houses available for sale across Auckland, the number of properties for sale in the region jumped by 1,135 (17%) compared to January 2016. This contrasts with declining numbers of properties for sale nationwide, with 3,743 fewer houses for sale in January compared to 12 months ago. Excluding Auckland, the number of properties for sale has fallen by 4,878 (-22%) over the past 12 months.
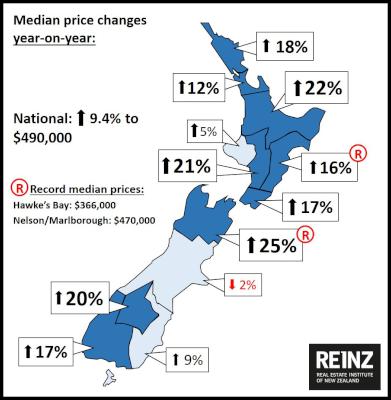
At the same time, median house prices have risen a seasonally adjusted 9.4% across New Zealand year-on-year to $490,000, firming slightly (+0.2%) and in line for this time of year. Two of 12 regions in New Zealand hit new record high median sale prices in January 2017 - Hawke’s Bay up 16% to $366,000, and Nelson/Marlborough up 25% to $470,000.
The number of sales for January 2017 was 4,307, down 6% on a seasonally adjusted basis compared to December 2016, which is in line with market expectations for this time of year.
KEY DATA SUMMARY:
https://www.reinz.co.nz/Media/Default/Statistic%20Documents/2017/Residential/January/REINZ%20Residential%20Press%20Release%20-%20Jan%202017%20FINAL.pdf
REINZ CEO Bindi Norwell says: “On a seasonally adjusted basis, which is always the most reliable guide, the real estate market saw prices steady and volumes down 6 percent in January. This is in line with expectations, as January is typically the quietest month in the market.
“Anecdotal evidence from agents around the country suggests that the market has been picking up speed again towards the end of January. The number of properties for sale in Auckland is certainly rising, with more than four months of supply now available and a rise of more than a month of supply over the past year. This lead indicator means greater choice for Auckland home buyers, and prompts us to ask whether the Auckland market is showing some early new signs of activity.
“Market fundamentals remain the same, with a rising population, housing shortage and historically low, although potentially rising, interest rates. We await the March data with interest, as a clearer picture will emerge of where the market is likely to head through 2017.”
Inventory
The number of properties available for sale continues to decline nationwide with 3,743 fewer houses for sale in January compared to 12 months ago, although the number of properties for sale in the Auckland region as increased by 1,135 (+17%). Compared to January 2016 the number of new listings fell 9% in Canterbury, 29% in Wellington and 16% in Waikato/Bay of Plenty. Excluding Auckland, the number of properties for sale has fallen by 4,878 (-22%) over the past 12 months.
Sales volumes
There were 4,307 unconditional residential sales in January, representing a 6% drop in the number of sales from December to January on a seasonally adjusted basis. This was in line with the percentage falls in December-January 2016 and December-January 2015.
Median prices rise, continuing to be led by the regions
The national median house price rose $42,000 (+9%) year-on-year. Compared to December the national median house price fell $26,000 (-5%). Nelson/Marlborough recorded the largest percentage increase in median price compared to January 2016, at 25%, followed by Waikato/Bay of Plenty at 22% and Manawatu/Wanganui at 21%.
Auction sales steady
There were 280 dwellings sold by auction nationally in January, representing 7% of all sales and a decrease of 138 (-33%) on the number of auctions in January 2016.
Transactions in Auckland represented 51% of national auction sales, with the number of auctions in Waikato/Bay of Plenty representing 26% of national auction sales and the number of auctions in Canterbury/Westland representing 5% of national auction sales. These three regions represented 83% of auction sales in January 2017.
Days to sell falls further
The number of days to sell increased by 10 days to 41 days from December, and remained steady at 41 days compared to January 2016. The number of days to sell typically jumps in January due to the holiday period. Otago had the fewest number of days to sell at 32 days followed by Nelson/Marlborough at 33 days and Central Otago Lakes at 35 days. Northland had the most number of days to sell at 48 days, while in Auckland the number of days to sell was 41 days.
Million dollar homes show increase in volumes
Between January 2016 and January 2017, the number of homes sold for more than $1 million rose by 8% to 456 homes to equal almost 11% of all dwellings sold. The number of dwellings sold under $600,000 has declined by 781 between January 2016 and January 2017 compared to a fall of 741 for all dwellings.
For regional commentary and tables, please see
the accompanying report.
REINZ_Residential_Regional_Commentary__January_2017_1.pdf
- ENDS -
Note to Editors:
The monthly REINZ residential sales reports remain the most recent, complete and accurate statistics on house prices and sales in New Zealand. They are based on actual sales reported by real estate agents. These sales are taken as of the date that a transaction becomes unconditional, up to 5:00pm on the last business day of the month. Other surveys of the residential property market are based on information from Territorial Authorities regarding settlement and the receipt of documents by the relevant Territorial Authority from a solicitor. As such, this information involves a lag of four to six weeks before the sale is recorded.
*Seasonal adjustment is a statistical technique that attempts to measure and remove the influences of predictable seasonal patterns to reveal how the market changes over time.
Further Data:
Across New Zealand the total value of residential sales, including sections, was $2.698 billion in January 2017, compared to $2.894 billion in January 2016 and $4.340 billion in December. For the 12 months ended January 2017 the total value of residential sales was $58.247 billion. The breakdown of the value of properties sold in January 2017 compared to January 2016 is:
| > | January 2017 | January 2016 | |||
|---|---|---|---|---|---|
| $1 million plus | 456 | 10.6% | 423 | 8.4% | |
| $600,000 to $999,999 | 1,135 | 26.4% | 1,128 | 22.3% | |
| $400,000 to $599,999 | 1,105 | 25.7% | 1,310 | 26.0% | |
| Under $400,000 | 1,611 | 37.4% | 2,187 | 43.3% | |
| All Properties Sold | 4,307 | 100.0% | 5,048 | 100.0% | |
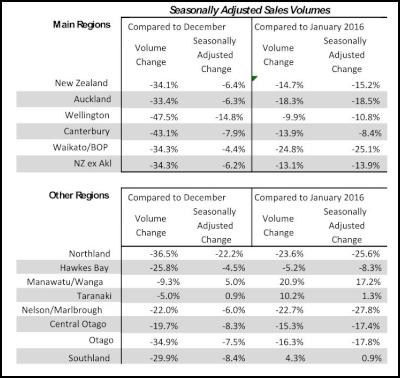
Seasonally Adjusted Sales Volumes
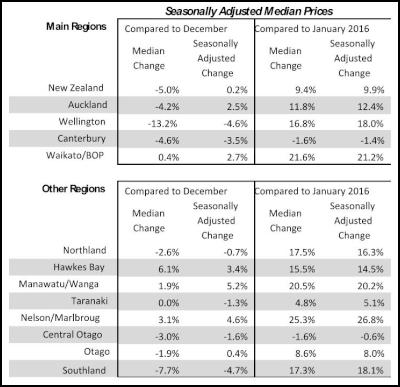
Seasonally Adjusted Median Price:
 Gordon Campbell: On Why We Can’t Survive Two More Years Of This
 NZ Police: Police Remind Hikers To Take Safety Precautions Following Wairere Falls Rescue
 ACT New Zealand: Liquor Stores Serving Us This Summer Deserve Thanks, And A Stronger Voice
 NZTA: Forecast Strong Winds For Auckland Harbour Bridge Traffic
 Queenstown Lakes District Council: Top 10 Most Hazardous Items Found In QLDC’s Waste Facilities And Rubbish And Recycling Bins In 2024
 NZ Government: Drive Safely This Summer
 Northland Inc: Game-Changing Investment For Northland - Resilience Fund Allocates $250,000 To Health Simulation & Training Centre