 Scoop has an Ethical Paywall


Regional predictions for the next three months
| February – April 2017 Issued: 02 February 2017 |
Overview Regional predictions for the next three months
NIWA Outlook: February – April 2017
Overview
The tropical Pacific is currently in an ENSO (El Niño – Southern Oscillation) neutral state (neither El Niño nor La Niña). Sea surface temperatures (SSTs) in the central Equatorial Pacific Ocean are marginally below average. In the sub-surface ocean, the pockets of cooler than average temperatures that remained in December 2016 have all but dissipated and slightly warmer than normal ocean waters are now present in the western equatorial Pacific. The Southern Oscillation Index is close to zero for January 2017. Except for some aspects of rainfall and convection anomalies along the equatorial Pacific, the weak La Niña-like signals that were present in previous months have now vanished.
International guidance favours ENSO-neutral conditions with high probability (90% chance) over the next three month period (February - April 2017). Later during the year, the models indicate substantial chances for a return to El Niño conditions (37% in August – October 2017), but note that ENSO forecasts beyond the Southern Hemisphere autumn are known to be less reliable than at other times of the year.
With the likely persistence of ENSO-neutral conditions, and the anticipated absence of other large-scale climate drivers over the next three months, the atmospheric circulation around New Zealand is expected to favour only slightly more westerly to south-westerly wind flows than normal.
Outlook Summary
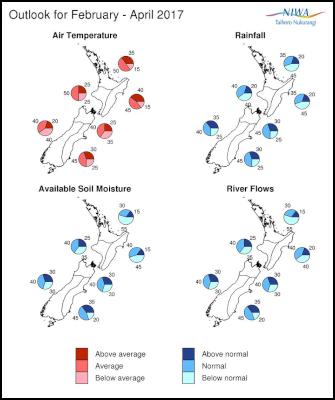
February – April 2017 temperatures are most likely (45-50% chance) to be near average for the north and west of the North Island and the east of the South Island. In the east of the North Island, February – April 2017 temperatures are about equally likely to be near average (45% chance) or above average (40% chance), and seasonal temperatures are about equally likely to be near average (40% chance) or below average (35% chance) in the north and west of the South Island.
February – April 2017 rainfall totals are most likely to be below normal (45% chance) in the north and east of the North Island, and equally likely to be near normal (40% chance) or below normal (40% chance) in the west of the North Island. Rainfall totals are about equally likely to be near normal (40% chance) or above normal (35% chance) for the west of the South Island. Near normal rainfall is most likely (40% chance) for the north and east of the South Island.
February – April 2017 soil moisture levels and river flows are most likely (55% chance) to be below normal for the north of the North Island and about equally likely to be normal (40% chance) or below normal (35-45% chance) for the east and west of the North Island. Near normal soil moisture levels and river flows are most likely (40-35% chance) for all regions of the South Island.
Regional predictions for the February – April 2017 season
Northland, Auckland, Waikato, Bay of Plenty
The table below shows the probabilities (or percent chances) for each of three categories: above average, near average, and below average. In the absence of any forecast guidance there would be an equal likelihood (33% chance) of the outcome being in any one of the three categories. Forecast information from local and global guidance models is used to indicate the deviation from equal chance expected for the coming three month period, with the following outcomes the most likely (but not certain) for this region:
• Temperatures are most likely to be near average (50% chance).
• Rainfall totals are most likely to be in the below normal range (45% chance).
• Soil moisture levels and river flows are most likely to be below normal (55% chance).
| The full probability breakdown is: | Temperature | Rainfall | Soil moisture | River flows |
| Above average | 35 | 20 | 15 | 15 |
| Near average | 50 | 35 | 30 | 30 |
| Below average | 15 | 45 | 55 | 55 |
Central North Island,
Taranaki, Whanganui, Manawatu, Wellington
Probabilities are assigned in three categories: above average, near average, and below average.
• Temperatures are most likely to be near average (50% chance).
• Rainfall totals are equally likely to be in the near normal (40% chance) or below normal range (40% chance).
• Soil moisture levels and river flows are about equally likely to be in the near normal (40% chance) or below normal range (35% chance).
| The full probability breakdown is: | Temperature | Rainfall | Soil moisture | River flows |
| Above average | 25 | 20 | 25 | 25 |
| Near average | 50 | 40 | 40 | 40 |
| Below average | 25 | 40 | 35 | 35 |
Gisborne, Hawke’s Bay,
Wairarapa
Probabilities are assigned in three categories: above average, near average, and below average.
• Temperatures are about equally likely to be near average (45% chance) or above average (40% chance).
• Rainfall totals are most likely to be in the below normal range (45% chance).
• Soil moisture levels and river flows are about equally likely to be near normal (40% chance) or below normal (40-45% chance).
| The full probability breakdown is: | Temperature | Rainfall | Soil moisture | River flows |
| Above average | 40 | 20 | 15 | 20 |
| Near average | 45 | 35 | 40 | 40 |
| Below average | 15 | 45 | 45 | 40 |
Tasman, Nelson,
Marlborough, Buller
Probabilities are assigned in three categories: above average, near average, and below average.
• Temperatures are about equally likely to be near average (40% chance) or below average (35% chance).
• Rainfall totals are most likely to be in the near normal range (45% chance).
• Soil moisture levels and river flows are most likely to be in the near normal range (40% chance).
| The full probability breakdown is: | Temperature | Rainfall | Soil moisture | River flows |
| Above average | 25 | 30 | 30 | 30 |
| Near average | 40 | 45 | 40 | 40 |
| Below average | 35 | 25 | 30 | 30 |
West Coast, Alps and
foothills, inland Otago, Southland
Probabilities are assigned in three categories: above average, near average, and below average.
• Temperatures are equally likely to be near average (40% chance) or below average (40% chance).
• Rainfall totals are about equally likely to be in the near normal (40% chance) or above normal (35% chance) range.
• Soil moisture levels and river flows are most likely to be in the near normal (40% chance) range.
| The full probability breakdown is: | Temperature | Rainfall | Soil moisture | River flows |
| Above average | 20 | 35 | 30 | 30 |
| Near average | 40 | 40 | 40 | 40 |
| Below average | 40 | 25 | 30 | 30 |
Coastal Canterbury, east
Otago
Probabilities are assigned in three categories: above average, near average, and below average.
• Temperatures are most likely to be near average (45% chance).
• Rainfall totals are most likely to be in the near normal range (45% chance).
• Soil moisture levels and river flows are most likely to be near normal (45% chance).
| The full probability breakdown is: | Temperature | Rainfall | Soil moisture | River flows |
| Above average | 30 | 30 | 35 | 35 |
| Near average | 45 | 45 | 45 | 45 |
| Below average | 25 | 25 | 20 | 20 |
Graphical
representation of the regional probabilities
Background
The tropical Pacific remains in El Niño-Southern Oscillation (ENSO) neutral state. Sea surface temperatures (SSTs) are slightly below average in the central and eastern Equatorial Pacific Ocean, from the International Date Line eastwards to about 90oW. The latest monthly SST anomaly (data ending 29 January 2017) in the NINO3.4 region (in the central Pacific) is at -0.30°C. The pockets of slightly cooler than normal sub-surface ocean waters that remained in the equatorial Pacific have now disappeared and warmer than normal (reaching about + 2oC) subsurface ocean waters are now present in the western and central Pacific, between 100 and 150m depth and between 160oE and 160oW.
The Southern Oscillation Index (SOI) is close to zero for January 2017 (+0.2, value estimated on 31 January 2017 using data to the 29th of January) and zonal wind anomalies are very close to zero or slightly positive (indicating weaker than normal trade-winds) all along the Equator: Large-scale circulation patterns are thus consistent with an ENSO-Neutral state. However, as was the case last month, rainfall and convection anomalies show some patterns reminiscent of typical (weak) La Niña conditions: in particular, convective activity and to some extent rainfall was more intense than normal over parts the Maritime Continent, while it was reduced in the central Pacific around and east of the International Date Line.
International guidance favours ENSO-neutral conditions with high probability (90% chance) over the next three month period (February - April 2017). Later during the year, the chances for a return to El Niño conditions increase substantially to reach 37% in August – October 2017. However it must be noted that ENSO forecasts going beyond the northern hemisphere spring are known to be less reliable than at other times of the year (the so-called “spring predictability barrier”).
Water temperatures surrounding New Zealand are close to or slightly below average. Along the immediate New Zealand coastline, sea surface temperatures (SSTs) are generally below to much below normal for the time of year. SSTs are, however, much warmer than average in the western part of the Tasman and along the east coast of Australia. The dynamical models’ forecasts for SSTs indicate that this pattern is likely to persist over the next three month period. Thus, coastal waters around the country are expected to be near or slightly below average as a whole for February – April 2017.
The 2016-17 tropical cyclone season is expected to produce near average activity across most islands of the southwest Pacific, but note that the February – April period is usually the most active part of the tropical cyclone season. Refer to NIWA’s Tropical Cyclone outlook at https://www.niwa.co.nz/news/southwest-pacific-tropical-cyclone-outlook for more information.
Notes to reporters and editors
1. NIWA’s outlooks indicate the likelihood of climate conditions being at, above, or below average for the season as a whole. They are not ‘weather forecasts’. It is not possible to forecast precise weather conditions three months ahead of time.
2. The outlooks are the result of the expert judgment of NIWA’s climate scientists. They take into account observations of atmospheric and ocean conditions and output from global and local climate models. The presence of El Niño or La Niña conditions and the sea surface temperatures around New Zealand can be a useful indicator of likely overall climate conditions for a season.
3. The outlooks state the probability for above average conditions, near average conditions, and below average conditions for rainfall, temperature, soil moisture, and river flows. For example, for winter (June–July–August) 2007, for all the North Island, we assigned the following probabilities for temperature: · Above average: 60 per cent · Near average: 30 per cent · Below average: 10 per cent We therefore concluded that above average temperatures were very likely.
4. This three-way probability means that a random choice would be correct only 33 per cent (or one-third) of the time. It would be like randomly throwing a dart at a board divided into three equal parts, or throwing a dice with three numbers on it. An analogy with coin tossing (a two-way probability) is not correct.
5. A 50 per cent ‘hit rate’ is substantially better than guesswork, and comparable with the skill level of the best overseas climate outlooks. See, for example, analysis of global outlooks issued by the International Research Institute for Climate and Society based in the US published in the Bulletin of the American Meteorological Society (Goddard, L., A. G. Barnston, and S. J. Mason, 2003: Evaluation of the IRI’s “net assessment” seasonal climate forecasts 1997–2001. Bull. Amer. Meteor. Soc., 84, 1761–1781).
6. Each month, NIWA publishes an analysis of how well its outlooks perform. This is available online and is sent to about 3500 recipients of NIWA’s newsletters, including many farmers. See www.niwa.co.nz/our-science/climate/publications/all/cu
7. All outlooks are for the three months as a whole. There will inevitably be wet and dry days, and hot and cold days, within a season. The exact range in temperature and rainfall within each of the three categories varies with location and season. However, as a guide, the “near average” or middle category for the temperature predictions includes deviations up to ±0.5°C for the long-term mean, whereas for rainfall the “near normal” category lies between approximately 80 per cent and 115 per cent of the long-term mean.
8. The seasonal climate outlooks are an output of a scientific research programme, supplemented by NIWA’s Capability Funding. NIWA does not have a government contract to produce these outlooks.
9. Where probabilities are within 5% of one another, the term “about equally” is used.
 Gordon Campbell: On The New Pope, And The Israeli Attack On Peter Davis
 Queer Endurance in Defiance: Wellington Queer Communities Protest Against NZ First’s Anti-Trans Bill
 Water New Zealand: Stormwater 2025 - Tackling Flooding And Storms To Build A Climate-Resilient Future
 New Zealand Labour Party: Labour Asks Why Govt Is Silent On Gaza
 Transport Accident Investigation Commission: Near-Collision Highlights Safety Lessons For All Busy, Unattended Aerodromes
 Green Party: Wildlife Law Change A Deep Betrayal Of Public Trust
 NZCTU: Unions Launch Petition To Protect Pay Equity