Dots Joined In New Rainfall Map
Dots Joined In New Rainfall Map

Click to enlarge
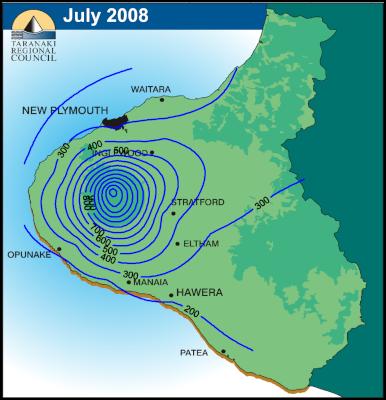
The contours on this map are isohyets showing the month’s rainfall in 100mm bands.
Taranaki Regional Council media
release
08 August 2008
For immediate
release
Graphic attached: Isohyet map for July
2008
DOTS JOINED IN NEW RAINFALL MAP
Rain – it
seems we get too much or too little. And now a useful new
picture of rainfall patterns is available from Taranaki’s
leading source of regional climatic data.
Monthly maps with contours called isohyets – giving a clear indication of the distribution and intensity of rain across the whole region, rather than just at actual measurement sites – are now being compiled by Taranaki Regional Council staff for publication on the Council’s website and in regional media.
The new maps add to the considerable rainfall information already available from the Council, including monthly and year-to-date maps showing rainfall totals at most of the 25 sites it monitors, and live rainfall data on the Council’s website.
“The new isohyet maps essentially join the dots between the monitored sites to give us a wider picture of what has happened,” says the Council’s Director-Environment Quality, Gary Bedford.
“By using statistical techniques and specialised computer software, our hydrologists and technical officers can use the existing data to draw a valid picture of the scope and scale of the month’s rainfall across Taranaki.
“We’re sure there’ll be a lot of interest in this. Live weather data is one of our website’s most popular features and let’s face it, just about everyone talks about the weather.”
Because the maps use interpolated data, they do not give exact rainfall totals at individual locations. Instead, their contour lines (isohyets) show monthly rainfall in 100mm bands. The gradation can be altered if conditions dictate.
An isohyet is defined as a line drawn on a weather map connecting points that receive equal amounts of precipitation during a given period.
For more information, see www.trc.govt.nz.
ENDS


 Gordon Campbell: On NZ’s Silence Over Gaza, And Creeping Health Privatisation
 ACT New Zealand: David Seymour's Budget Day Speech 2025
 Government: Minister Of Finance’s Budget 2025 Speech
 The Prosperity Deal: Govt Budget Has No Plan For AI Job Loss – Citizens Launch The Prosperity Deal As The Only Workable Alternative
 Greenpeace New Zealand: Greenpeace Braced For ‘Scorched Earth’ Budget From Govt
 NZ Police: Police Acknowledge Sentencing Of Donald Sarratt In Child Sexual Abuse Material Case
 PSA: Ministry Of Education Workers Will Walk Off The Job For The First Time In Over 20 Years


