Tax Reform in Picturesby Keith Rankin, 17 March 2010
On 8 February and 8 March I published a number of tables that show, for individual taxpayers, average and marginal tax rates for: the status quo;
conservative reform options that recognise the comparatively high rates of tax that low income that New Zealanders pay;
and less conservative (but even more principled) "refundable tax credit" options that integrate a flat tax (inclusive of
ACC) with a basic universal benefit.
For labelling purposes, we can call this last option either the "refundable tax credit" or the "basic income" option.
Gareth Morgan offered a guaranteed minimum income option to the New Zealand public in December 2009. His option was for a $10,000 refundable tax credit, a flat tax rate
of 25%, and a property tax (reminiscent of the tax that operated in New Zealand in the 1880s) to make up for lost
revenue. Morgan disavows the principle of vertical equity (that people with specific claims should receive specific
recognition) by suggesting the abolition of all forms of benefit other than tax credits.
My refundable tax credit proposal is for a $8,000 basic benefit paid by Inland Revenue. (This compares with the current
unemployment benefit for a married person or a young adult of $8,250), and a flat employee tax of 36.2% (34.5% plus 1.7%
Accident Compensation levy). In this relatively conservative proposal, new forms of tax are not required to fund such a
benefit. Savings occur though the simplification of the system (for example the Department of Work and Income could
halve its customer base), and the reduced opportunities for tax avoidance made possible from a single rate of income
tax.
Here I present the options in easy-to-read graphical form. I use a representative individual – "Cathy" – to show the
benefits she would get if she lost her job and/or could only obtain part-time or other low-paid employment. Cathy is 30
and lives in rented accommodation in Wellington.
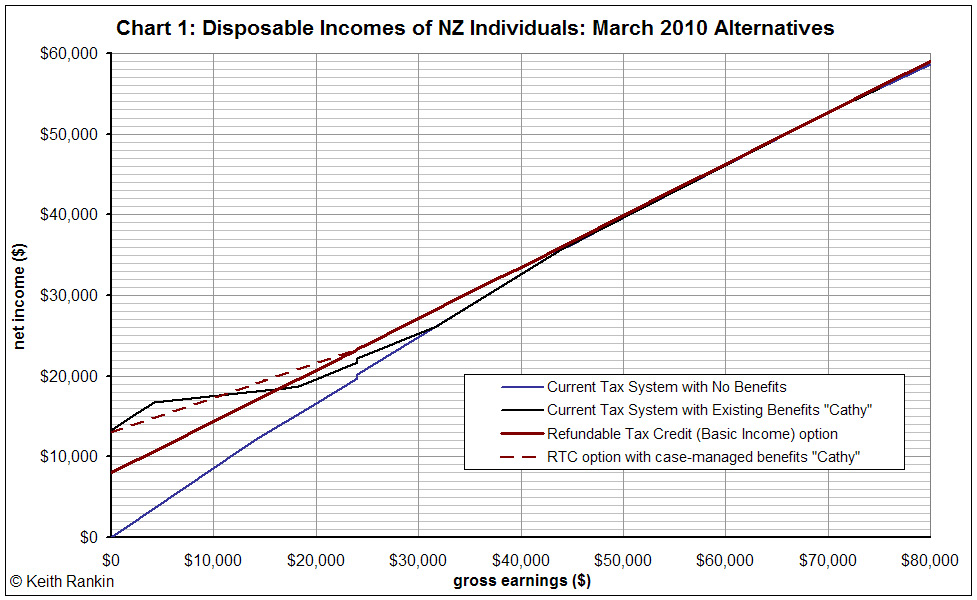
Chart 1 shows after-tax (net) incomes in relation to before-tax (gross) earnings. It also compares the basic income
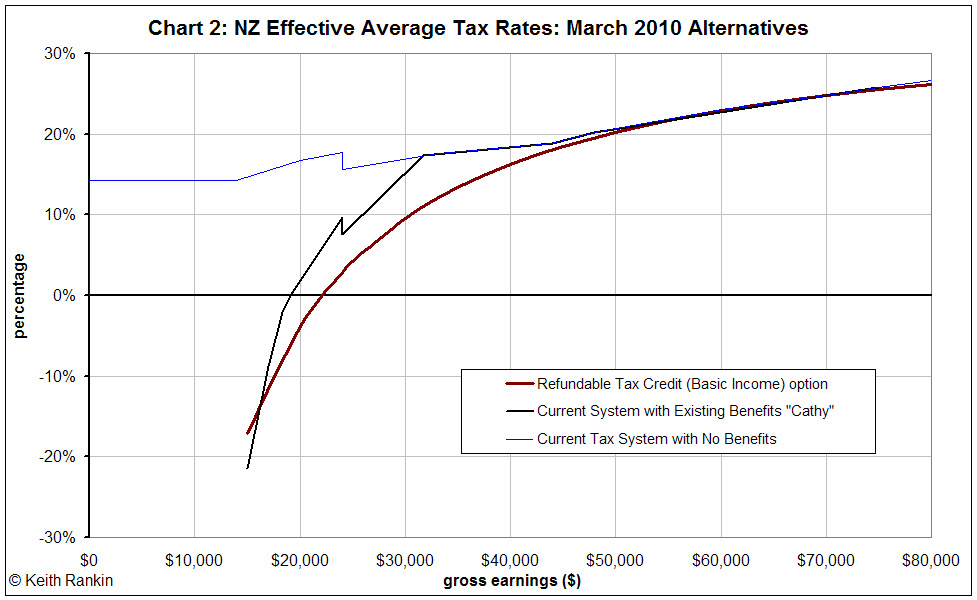
option with current tax and benefit rates. Chart 2 shows current average tax rates (benefits included and not included)
and effective average tax rates for the basic income option. (Note that when benefits are included average tax rates
become "effective average tax rates.)
In Chart 1, the basic income option is represented by the consistent, thick, straight red line. In addition, the dashed
line shows Cathy's disposable income if we allow for case-managed Work and Income benefit payments as suggested in my
March article.
The other two lines in Chart 1 represent Cathy's current tax rates with and without the inclusion of benefits –
unemployment benefit and accommodation supplement – she could be eligible for. For incomes above $80,000 – not shown –
the basic income option given here represents a small tax cut, given that 36.2% is less than the current top marginal
rate of 39.7%. In Chart 1, the wrinkle in the present scale is clearly visible at gross earnings of $24,000.
The principal impression here is that current welfare benefits are principally funded by the over-taxation of persons
earning between $17,000 and $44,000, with persons just below $24,000 or earning around $33,000 being especially
disadvantaged.
This is dangerous policymaking for two reasons. First, it facilitates a belief among low-paid employed people that
benefits are disproportionately funded from their taxes; in effect, low-wage workers are played off against
"beneficiaries", and may blame beneficiaries for their plight. Second, relatively high taxes on the low paid reduce the
advantages for beneficiaries to move into substantial part-time employment.
Chart 2 confirms these findings, showing the comparatively high taxes faced by low income earners, and showing the steep
increases in effective tax rates when people receiving some kind of benefit assistance increase their earnings.
The basic income option leaves low-paid workers with more, relative to beneficiaries with minimal earnings.
Beneficiaries gain, however, in the sense that the larger part of their benefit (here, $153 per week) is unconditional,
and that they lose their optional case-managed benefit at a lower and more consistent rate when their earnings increase.
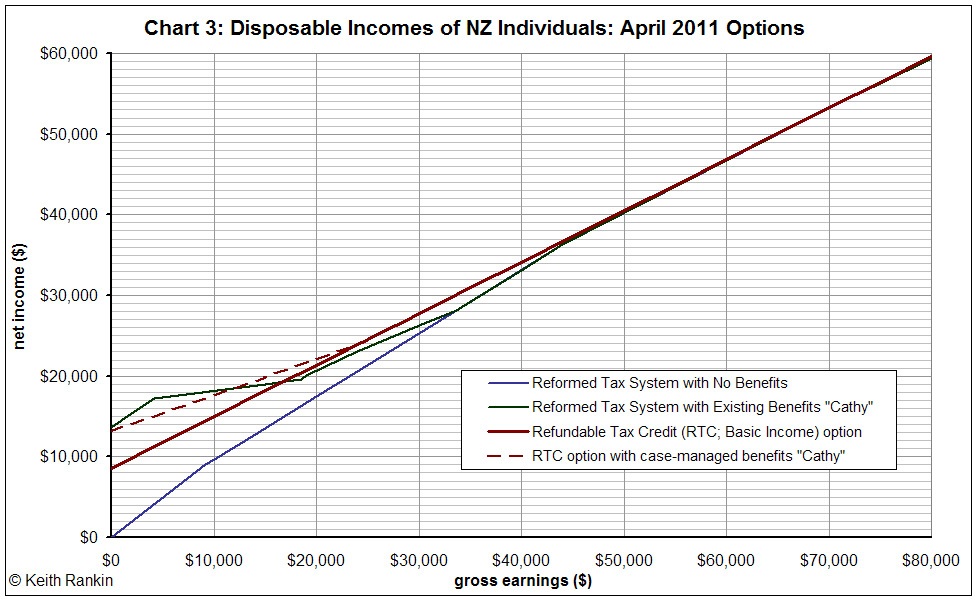
My final two charts show the situation that would occur in April 2011 if the government both restores its December 2008 tax legislation and removes the present wrinkles that are inequitable to people earning less than $24,000. This is the conservative
"Reformed Tax System" option. It also shows a version of the less conservative basic income option where the refundable
tax credit is set at the level ($8,600), which will be the level of the inflation-adjusted basic unemployment benefit
(payable to married persons and single adults under 25).
In Chart 3 we see the wrinkles ironed out, and the blue (no benefits) line angled at 45 degrees (meaning zero tax) for
the first $9,150 of earnings. When present benefits are included, the clear impression remains, however, of an overtaxed
group earning between $18,000 and $44,000 per year (mostly low-paid fulltime workers). And once again, the basic income
option appears more principled (especially compared to the 'ad hoc' nature of the present tax-benefit scale shown in
Chart 1), with its simple flat rate and its option for unemployed persons to trade a lower unconditional benefit paid by
Inland Revenue for the higher but much more bureaucratic benefits available under the present benefit system.
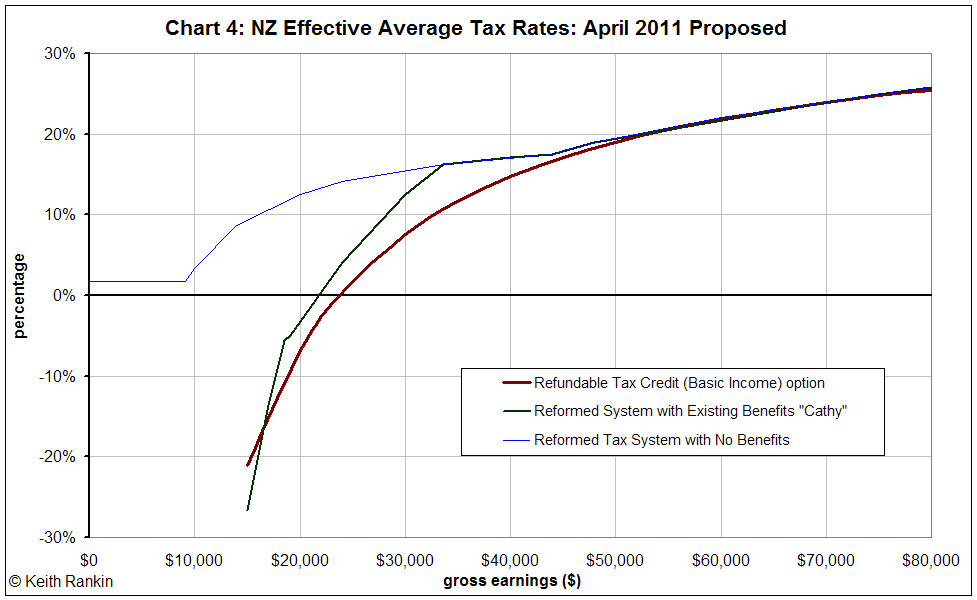
In Chart 4 we see even more clearly the impact of the conservative "non refundable tax credit" reform that I applied to
the scale National legislated for in December 2008 (and rescinded in 2009). While the thin blue line – taxes only – is
much lower in Chart 4 than in Chart 2, the average tax rates for incomes above $60,000 are only slightly lower than in
Chart 2. This conservative reform that I have suggested clearly targets those on the lowest incomes for tax cuts.
Despite the possibilities shown of cutting taxes to lower income recipients, the basic income option remains the
simplest and the most principled option. It is based on two principles: that all incomes should be taxed at the same
percentage rate, and that, because public revenue is the property of the public, then it should be dispersed
approximately equally. The refundable tax credit of $8,000 in 2010 or $8,600 in 2011 represents the principle that
public revenue should equally benefit everyone.
One issue that generally crops up in debates about taxes and benefits is the "incentive to work". Some people worry that
the provision of any unconditional benefit is a licence to a lifestyle of idleness. This worry is unfounded; people
generally require little incentive to materially contribute to their societies. It is an important truth of economics
that "incentives matter". In this case, an unconditional benefit set at a lower rate than present conditional benefits
produces every incentive to work for some level of private income. Secondly, the lack of work-disincentive in the form
of high benefit abatements means that low income recipients always will be rewarded by working longer hours or by
negotiating higher wage rates.
(While payment of benefits as tax credits is inherently attractive to neoclassical economists, many such economists also
worry that economic crises are perpetuated by wage rates not falling to market-clearing levels. Economists who have this
concern are uncomfortable with any kind of unconditional benefit, because such a benefit – as a fallback position – may
give some bargaining power to workers who may be receiving above-market-clearing wages.)
We should note two principles required to guide the setting of tax rates over time. First, that, as GDP increases, then
the public share of GDP should not fall. That means cash and non-cash benefits – including any refundable or
non-refundable tax credits – should be indexed to GDP, which, in a growing economy, means that such benefits should rise
more quickly than the rate of inflation. Second, it is very likely that public investment – eg in infrastructure,
health, knowledge and education – is a significant determinant of long run productivity growth. If that is so, then the
public share of the economy (that is, the return on past public investment) should be rising, with the implication that,
over time, refundable tax credits or other benefits payable as growth dividends should rise at a slightly faster rate
than the overall rate of economic growth. Certainly historical growth has largely been due to an expanded public
resource base.
The impediments to principled tax reform are political rather than economic. Good options – less inefficient and less
inequitable – are there if we care to look.
*************
krankin @ unitec.ac.nz