 Scoop has an Ethical Paywall


Warner Bros. Discovery And Paramount Global Hope SVOD Demand Catalyzes Wall Street Rebound [Parrot Analytics]
Two of the three largest media companies by corporate demand share report earnings Thursday morning in the biggest stress test for the entertainment sector since Netflix beat its very low subscriber expectations last month.
Due to the combination of Discovery Inc. and WarnerMedia’s assets, just three conglomerates — The Walt Disney Company (19.7%), Warner Bros. Discovery (17.8%), and Paramount Global (12.5%) — now control half of the US audience demand for TV content.
Wall Street will assess how Warner Bros. Discovery CEO David Zaslav fares in his quest for $3 billion (and probably more) in cost cuts, and awaits a concrete plan for combining HBO Max and Discovery+ into one service.
Paramount Global reports Thursday as well. The company hopes to further bridge the gap between its solid standing in TV demand ownership and its softer, but growing, streaming originals and on-platform demand share for Paramount+.
Paramount has received mixed signals from the market of late, with Warren Buffett’s Berkshire Hathaway buying a $2.6 billion stake earlier this year, while MoffettNathanson recently downgraded the stock due to fears of lower advertising revenue as a result of those proverbial economic headwinds.
In terms of content, the audience for WBD’s crown jewel asset HBO Max continues to grow rapidly. The total US demand for HBO Max’s original series is up 102% since Q1 2021, more than double the growth rate of its combined competition. This is a strong leading indicator for further subscriber growth, which should accelerate in Q3 and Q4 with the long awaited House of the Dragon debuting later this month.
The major question now becomes how and when to combine Discovery+ and HBO Max. Demographic data presented below suggests the streamers will fill in each other’s respective age and gender gaps, but it’s less clear how much each platform's audiences will actually want the other’s content.
While Paramount Global is in third place in corporate share, Paramount+ is tied for fourth in on-platform demand, and stuck in seventh in originals demand share in the US and worldwide.
That said, Paramount+’s originals demand share has grown for four straight quarters, and the total demand for its originals has grown 30 points faster than the competition since Q1 2021. This has coincided with massive increase in Paramount+’s subscriber base.
One more thing…
Parrot Analytics demand data also highlights a potential threat to Disney on the horizon. A strictly hypothetical, regulatory environment notwithstanding, merger between NBCUniversal’s and Paramount Global’s media assets would create a company that accounts for 22.6% US corporate demand share, roughly three percentage points higher than Disney.
The Warner Bros. Discovery merger put it within two points of Disney in this category, but NBCU and Paramount combined would immediately leapfrog Disney as the dominant media company in the US in terms of cross platform audience demand for TV content.
US Corporate Demand Share - Q2 2022
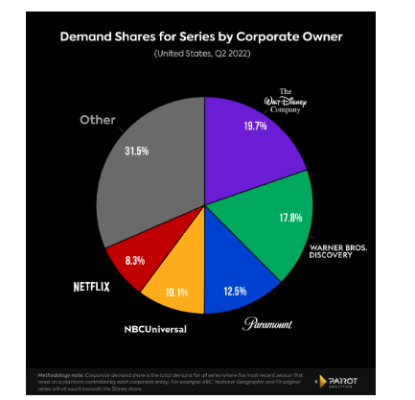
- Corporate demand share assesses the long-term viability of the top media companies as they look to consolidate their original content’s availability exclusively onto their own platforms.
- This chart reveals the immediate power of the Warner Bros. Discovery merger. In Q1, WarnerMedia (11.7%) and Discovery Inc. (6.6%) were in third, and sixth place, respectively.
- By combining forces, WBD (17.8% in Q2) is immediately the second biggest media conglomerate, in a position to directly challenge Disney as the dominate cross platform media company with US audiences.
- Paramount Global dropped to third place from its long hold on second place, behind Disney, following the WBD merger.
- If Paramount joins forces with fourth place NBCUniversal — which would of course require jumping through regulatory loopholes and probably spinning off CBS/CBS News as a separate entity — the combined company would have 22.6% share, well ahead of Disney.
US On-Platform Demand Share - Q2 2022
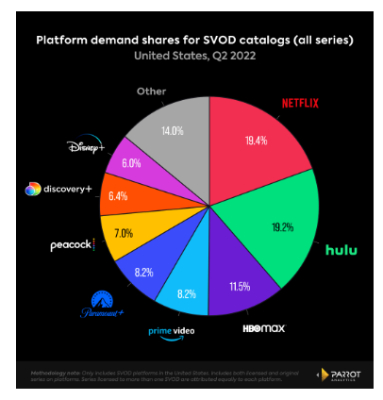
- On-platform demand share is an indicator of which platforms are more likely to be a consumer’s default “streaming home.”
- HBO Max is in a solid third place for on-platform demand share — which includes all licensed and exclusive programming available on HBO Max.
- Adding Discovery+’s on-platform demand to HBO Max would create a service with 17.9% demand share, just a few points behind Hulu (19.2%) and Netflix (19.4%), highlighting another reason these companies have joined forces, and why Zaslav has publicly touted a future combination of the two streamers.
- Paramount+ (8.2%) is tied with Amazon Prime Video (8.2%) for fourth place here. This ranking matters because surveys suggest consumers are willing to pay for three to four streaming services.
- Getting into fourth place, or third if possible, is thus crucial for Paramount+’s long term viability as a standalone streaming service.
US Originals Demand Growth: HBO Max vs All Other Services

- The total demand for HBO Max originals has doubled since the beginning of 2021 with US audiences, up 102%.
- The total demand for originals from all other streamers was up 44% in the same amount of time, meaning demand for HBO Max originals has grown at more than double the rate of the competition.
- Q2 2022 saw a further acceleration of demand growth for HBO Max originals — up 21.4% vs 12% for all others.
- This was led by surprise breakout hit Our Flag Means Death. Although it ended in late March, the queer pirate workplace comedy grew its audience demand in the weeks and even months following its season one finale, becoming the most in-demand HBO Max original in Q2 2022 in the US and worldwide.
US Originals Demand Growth: Paramount+ vs All Other Services
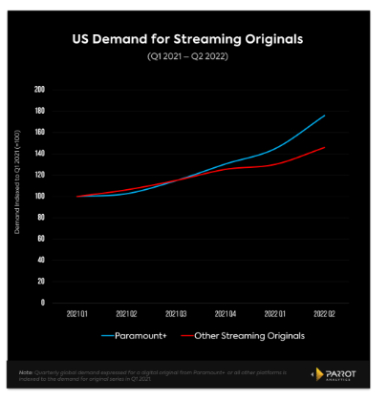
- Demand growth for Paramount+ originals maintained or trailed that of all other streaming services through Q3 2021, but since Q4 2021, Paramount+ originals have grown at a significantly faster pace than that of other services.
- Since Q1 2021, the total demand for Paramount+ originals grew 76%, significantly higher than the growth rate of all non-Paramount+ streaming originals, which were up 46%.
- This has been the result of a newfound focus on original series, led by Star Trek: Picard, Star Trek: Strange New Worlds, Halo, 1883, Mayor of Kingstown, and more.
- In fact, while Paramount+ has a lighter supply of originals than most of its rivals, it has the highest average demand per original series of any of the major services over the last year.
Demand Share of Hits - Streamers with the most shows in the top 2.9%
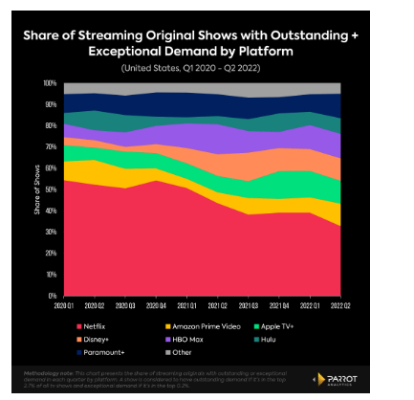
- Both Paramount+ and HBO Max have seen sizable growth in originals demand share in the last year.
- In the US, HBO Max grew from 5.8% in Q2 2021 to 7.5% in Q2 2022, and Paramount+ increased from 3.4% to 5.4% over the same time. These demand share increases have directly carved into Netflix’s dominant position in the market.
- The most efficient way to achieve this growth is by consistently landing hit original series, and both services are accounting for an increasing share of the most in-demand streaming originals with US consumers.
- In Q2 2022, HBO Max and Paramount+ were both tied for second place (11.5% each) — behind Netflix (32.8%) — in the US share of Outstanding and Exceptional series. That is, shows that sustained more than 8x the demand of the average show in the US for an entire quarter and were thus in the top 2.9% of all shows.
Platform Merger? Audience Profiles for HBO Max & Discovery+
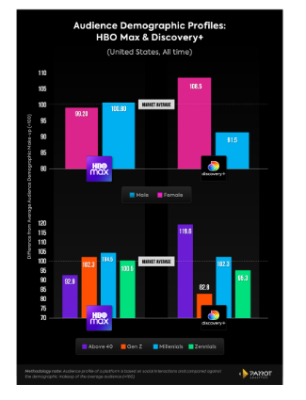
- HBO Max’s audience is very close to the industry standard as far as gender breakdown is concerned. The platform skews slightly more male than the industry average.
- Discovery+ on the other had over-indexes with women by a significant margin, likely a result of its emphasis on unscripted lifestyle programming.
- Looking at audience age data, it’s clear that Discovery+ over-indexes with Above 40s, which will help fill in HBO Max’s large underperformance with this segment. HBO Max over-indexes with Gen Zs and Millennials, which Discovery+ is lacking at the moment.
- It’s thus clear that HBO Max and Discovery+ are complementary in terms of creating a four quadrant general entertainment streaming service by targeting audiences segments the other one isn’t reaching.
- However, it remains to be seen whether HBO Max subscribers will actually want Discovery+ content on their home screens, and vice versa.
Notes on House of the Dragon — All About Affinity
All signals point to HBO’s House of the Dragon having a massive launch, with pre-release demand already reaching Exceptional (top 0.2%) levels worldwide, and the original Game of Thrones being the most in-demand series available on HBO Max in the US and around the world in Q2 2022.
But a series with a budget and ambitions as high as that of House of the Dragon needs to do more than just hit Exceptional demand and number one show worldwide status to maximize its value to HBO Max.
The real question is will this new tentpole have affinity for other (non-Game of Thrones) series that are exclusive to HBO Max? In other words, will new HBO Max subscribers who come for House of the Dragon stick around for other exclusive HBO Max content after the season one finale, and become long term subscribers?
Over the last seven days, of the top 10 titles with the highest consumption affinity to Game of Thrones, only two series — South Park and Rick and Morty — were available on HBO Max, and neither of those series is exclusive to HBO Max. Game of Thrones viewers are largely seeking out content on other services, putting them at a high risk of churning out entirely. During the 2010s HBO Now subscribers routinely churned following Game of Thrones season finales and didn't return until just before the next premiere, often over a year away.
House of the Dragon will need to do better with affinity for HBO Max exclusives in order to justify its production and marketing spend, and in order to maximize its overall value to the HBO Max platform.
Parrot Analytics
Global television demand measurement
Parrot Analytics is the leading global content demand analytics company for the multi-platform TV business. With the world's largest TV audience demand datasets, the company currently tracks more than 1.5B daily expressions of demand in over 100 languages from 200+ countries to reveal the content consumers engage with and watch the most across platforms.
As a trusted partner to some of the biggest media companies and content creators in the world, Parrot Analytics optimises content workflows in real time. The company's TV analytics products result in better production, distribution, acquisition and marketing decisions, as well as accelerated SVOD platform success.
 Vegetables New Zealand: Asparagus Season In Full Flight: Get It While You Still Can
  Bill Bennett: Download Weekly - How would NZ telecoms cope with another cyclone
 NZ On Air: Firm Audience Favourites Lead NZ On Air Non-Fiction Funding
 Insurance and Financial Services Ombudsman: Woman Gets $40k More After Disputing Insurer’s Decision
 BNZ: A Quarter Of Older NZers Fear Going Online Due To Scam Concerns
 University of Auckland: Scientists Develop Tool To Monitor Coastal Erosion In Fine Detail


